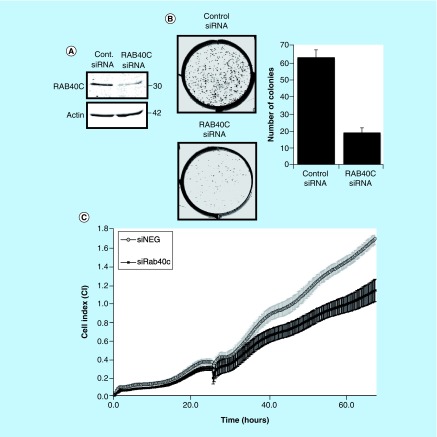
Figure 4. . Effect of knockdown of RAB40C on colon cancer cells.
(A) Representative western blot showing RAB40C knockdown (10 nM) in HCT116 (n = 3). (B) Representative image demonstrating the difference in cells ability to form colonies when RAB40C is knocked down. Bar graph shows the different number of colonies scored as positive (>50 cells) after 8 days (in six different wells repeated in two individual experiments). (C) Representative graph of cell proliferation over a period of 65 h analyzed in real time on the xCELLigence system. Standard deviation calculated on the average of eight different wells.

