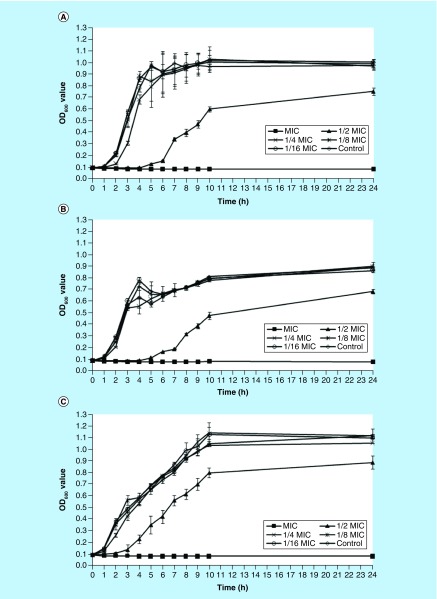
Figure 1. . Growth curves of Staphylococcus aureus strains in the presence of graded subinhibitory concentrations of NH125.
These curves represent the mean values of three repeat testing results. Error bars represent standard deviation. (A) Strain MW2; (B) strain USA300; (C) strain Newman; control strain treated by 1% DMSO.
OD: Optical density.

