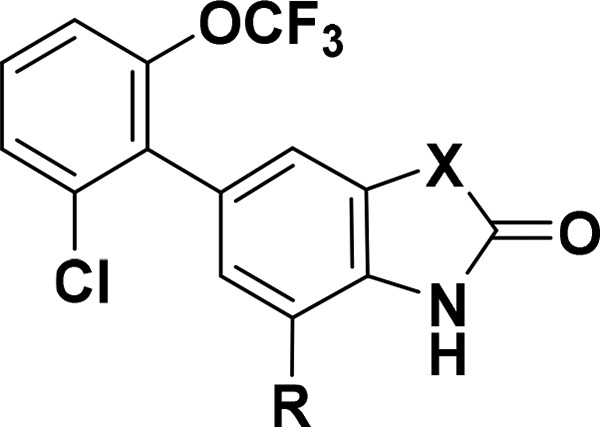
Table 3. Reactive Metabolite SAR for Analogs of Compound 3.

| Cmpd | X | R | GluA1/γ-8 pIC50a | GSH adductb | cLogP |
|---|---|---|---|---|---|
| 3 | NH | H | 8.3 ± 0.31 | yes | 4.1 |
| 14 | O | H | 5.6 (n = 1) | yes | 4.1 |
| 15 | S | H | 8.6 ± 0.3 | yes | 4.7 |
| 16 | CH2 | H | 7.8 ± 0.2 | no | 3.6 |
| 17 | CH2 | F | 8.6 ± 0.3 | no | 4.1 |
| 18 | CH2 | CH3 | 9.7 ± 0.3 | no | 4.2 |
pIC50 measured in a FLIPR assay using HEK-293 cells expressing a human GluA1o-γ-8 fusion construct; unless noted, all data are the result of at least three assays run in triplicate with the mean value and standard deviation reported.
Compounds were incubated for 1 h in human liver microsomes supplemented with glutathione (GSH) and NADPH.
