. 2018 Jun 28;54(65):8972–8975. doi: 10.1039/c8cc04437f

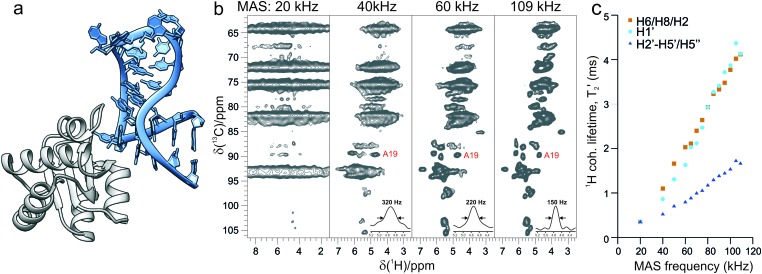
Fig. 1. (a) Structural model of the 26mer Box C/D RNA (light blue) bound to the L7Ae protein (grey) from Pf, established by alignment of the previously determined MAS NMR structure (PDB ; 2N0R)3 of the RNA from Pf with a homologous RNA sequence in a larger complex (PDB ; 3NMU). (b) Ribose and base C5–H5 regions of 13C–1H CP-HSQC spectra recorded on a 800 MHz spectrometer at MAS rates of 20, 40, 60 and 109 kHz, characteristic for commercial 3.2, 1.9, 1.3 and 0.7 mm MAS probes. 1D traces of a representative resonance with the corresponding proton line width are shown in the bottom right corner. (c) Bulk coherence lifetimes (T2′) of base H6, H8 and H2 (brown squares), ribose H1′ (cyan circles) and other ribose H2′–H5′′ protons (blue triangles) measured on a 800 MHz spectrometer and MAS frequencies from 20 to 109 kHz.

Fig. 1