. 2018 Jun 28;54(65):8972–8975. doi: 10.1039/c8cc04437f

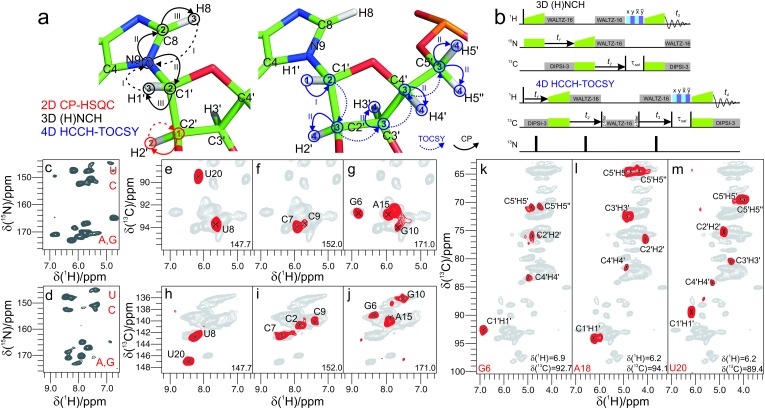
Fig. 3. (a and b) Magnetization transfer and radiofrequency irradiation schemes: 2D 13C–1H CP-HSQC (color-coded in red), 3D (H)NCH (in black), and 4D HCCH-TOCSY (in blue). Arabic numbers in (a) indicate spectral dimensions (t1t4) in the pulse schemes (b); roman numbers indicate the CP transfers. (c and d) 2D 15N(t1)–1H projections of 3D (H)NCH experiments tuned to either ribose or base resonances. (e–j) Representative 13C–1H cross-sections from the (H)NCH spectra showing either ribose N1/N9–C1′–H1′ (e–g) or base N1–C6–H6 or N9–C8–H8 correlations (h–j), at the 15N frequency indicated in each panel. (k–m) Assignment of ribose spin systems with the 4D HCCH-TOCSY experiment. Representative 2D planes from the 4D experiment showing the spin systems of G6 (k), A18 (l), U20 (m). 1H and 13C frequencies are indicated in each panel. For reference, in panels (e–m) the red contours of either (H)NCH or HCCH-TOCSY spectra are overlaid onto 2D CP-HSQC spectra (in grey). (H)NCH spectra were recorded on a 1 GHz spectrometer at 111 kHz MAS, while the HCCH-TOCSY spectrum was recorded on a 800 MHz spectrometer at MAS frequency of 100 kHz.

Fig. 3