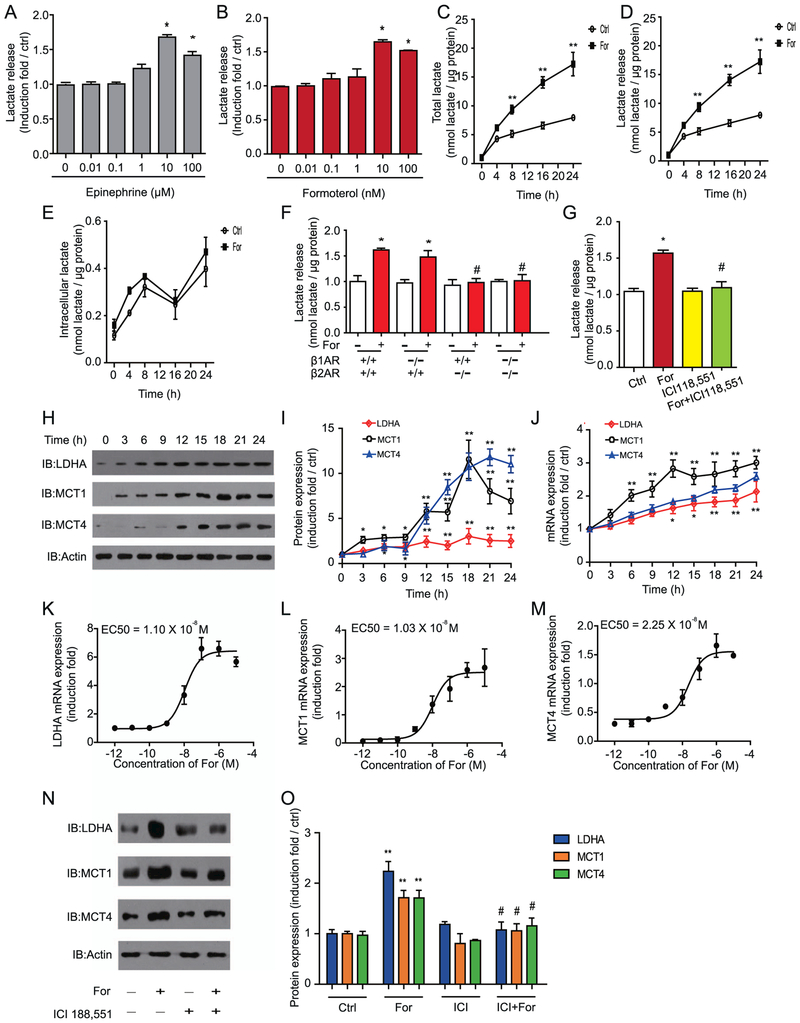
Figure 3.
Activation of β2-adrenergic receptor (β2AR) promotes lactate synthesis and transport and increases expression of key elements in the lactate metabolism in astrocytes in a dose- and time-dependent manner. (A, B) The β2AR agonists (A) formoterol (For) and (B) epinephrine induced lactate release in a dose-dependent manner. Cells were treated with 0, 0.01, 0.1, 1, 10, and 100 μmol/L of epinephrine (left panel) or 0, 0.01, 0.1, 1, 10, and 100 nmol/L of formoterol (right panel) separately for 16 hours. Data are averages of at least three independent experiments and are presented as induction folds over control (Ctrl) levels. (C–E) Formoterol promoted lactate synthesis and transportation in U251 cells. (C) Total lactate amount, (D) lactate release, and (E) intracellular lactate levels were measured after cells were treated with 10 nmol/L of formoterol. The y-axis represents the concentration of lactate (nmol) over the total amount of protein (μg). The solid line depicts data from cells infused with formoterol, and the dashed line depicts control data. Data are averages of at least three independent experiments. (F) Formoterol promoted lactate release through β2AR. Primary cultured mouse astrocytes from β1AR−/−, β2AR−/−, and β1AR−/−/ β2AR−/− mice and their wild-type littermates were treated with or without 10 nmol/L of formoterol for 16 hours. The y-axis represents lactate release in the treated groups vs. control. (G) The effect of selective β2AR antagonists on the response to formoterol in astrocytes. The column represents the induction folds of lactate release over the control. (H, I) Activation of βARs by formoterol increased protein levels of lactate dehydrogenase A (LDHA), monocarboxylate transporter 1 (MCT1), and MCT4 in a time-dependent manner. (H) Representative Western blot images of LDHA, MCT1, and MCT4. (I) Bands from Western blots (performed in triplicate as a minimum) were quantified and expressed as induction folds over control (LDHA, *p = .049, p = .047, **p = .008, p = .009, p = .005, p = .006, p = .005; MCT1, *p = .025, p = .019, p = .017, **p = .006, p = .0058, p = .0072, p = .0066, p = .0058; MCT4, *p = .013, p = .025, **p = .0083, p = .0064, p = .0077, p = .0069, p = .0062). (J) Formoterol increased messenger RNA (mRNA) LDHA, MCT1, and MCT4 levels in a time-dependent manner, as examined by quantitative reverse transcriptase polymerase chain reaction. (K–M) Concentration-dependent effects of formoterol (12 hours) on LDHA, MCT1, and MCT4 mRNA levels in U251 cells. (N, O) Formoterol-stimulated LDHA, MCT1, and MCT4 protein expression increases through activation of β2ARs. (N) Representative Western blot images of LDHA, MCT1, and MCT4. Western bands from at least triplicate experiments, as shown in (N), were quantified and are shown as induction folds over the control in (O) (**p = .0074, p = .0087, p = .009; #p = .018, p = .017, p = .012). (A–O) All data points were obtained from mean values (±SEM) of at least three independent samples. *p < .05; **p < .01; agonist-treated samples were compared with nontreated samples. #p < .05; β1AR−/−/β2AR−/− mice were compared with WT mice, and antagonist (ICI 118,551)-treated samples were compared with cells treated with formoterol only. EC50, concentration for 50% of maximal effect; IB, immunoblot.

