
Figure 1.
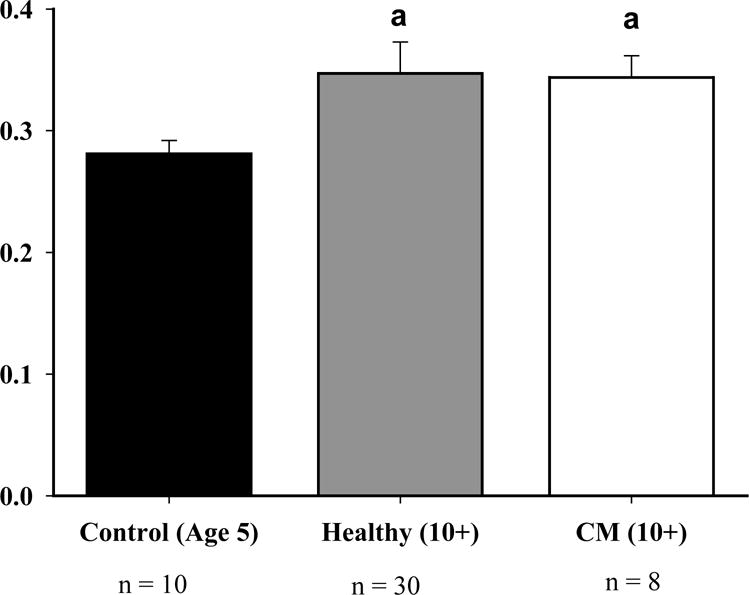
The LVPWd for healthy owl monkeys had a 23% increase when compared to the control group (P<0.05). In addition, there was a 22% increase in cardiomyopathy monkeys when compared to the control group (P<0.05). The a above the graph represents that both healthy and cardiomyopathy were greater than control.