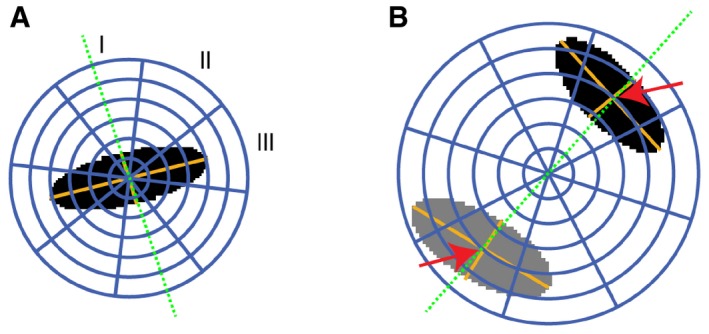
Figure EV1. Definition of spherical ROIs.

- In cells during metaphase, a 3D ellipsoid (black area) was fitted to the DAPI signal to determine the orientation of the mitotic axis (green dotted line). This axis was defined by the smallest axis of the ellipsoid. Relative to the mitotic axis, three spherical sectors (I, polar; II, diagonal; III, equatorial) were delineated. Six shells were defined by dividing the sphere radius into six equally large intervals, of which the inner four spanned the largest ellipsoid axis nucleus area. Finally, 18 spherical 3D partitions were defined as intersections between spherical sectors and shells.
- In cells during segregation, two ellipsoids were fitted to the chromatin regions (black and gray areas). The mitotic axis (green dotted line) was defined by the centroid to centroid vector. The map of spherical ROIs was specified relative to the centroid distances of the two chromatin regions. Six shells with equal radius intervals were defined by scaling the fourth shell to the distance between the centers of the two ellipsoids (red arrows).
