
Figure 2. Localization and intensity changes in untreated MCF10A and MCF10CA cells.
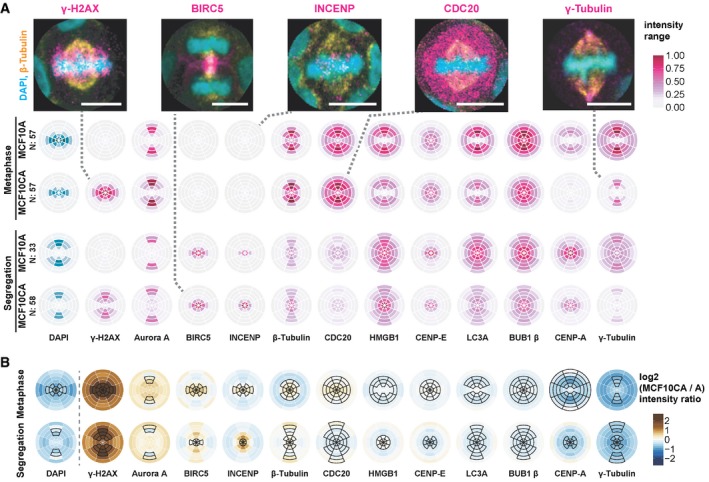
- Localization of epitopes of twelve antibodies, besides DAPI staining, during metaphase and segregation (comprising ana‐ and telophase). SpheriCell plots depict mean intensity values across all imaging rounds. Stainings of proteins were ordered by decreasing difference between MCF10CA and MCF10A cells. Intensity ranges were specific to the antibody and are shown normalized between 0 and 1, effectively across all values of a column in the figure. Distribution patterns generally reflect the localization of individual proteins described before. Dashed lines connect SpheriCell plots with example images of antibody stainings (magenta), DAPI (cyan), and β‐tubulin (yellow) (scale bars: 10 μm). LC3A: microtubule‐associated proteins 1A/1B light chain 3A.
- MCF10CA shows altered intensity patterns compared to MCF10A. SpheriCell plots depict differences of log2 transformed fluorescence intensity of MCF10CA and MCF10A [log2(CA) – log2(A)] for metaphase and segregation, in decreasing order. Black framed partitions indicate intensity distributions in untreated control images. LC3A, microtubule‐associated proteins 1A/1B light chain 3A.