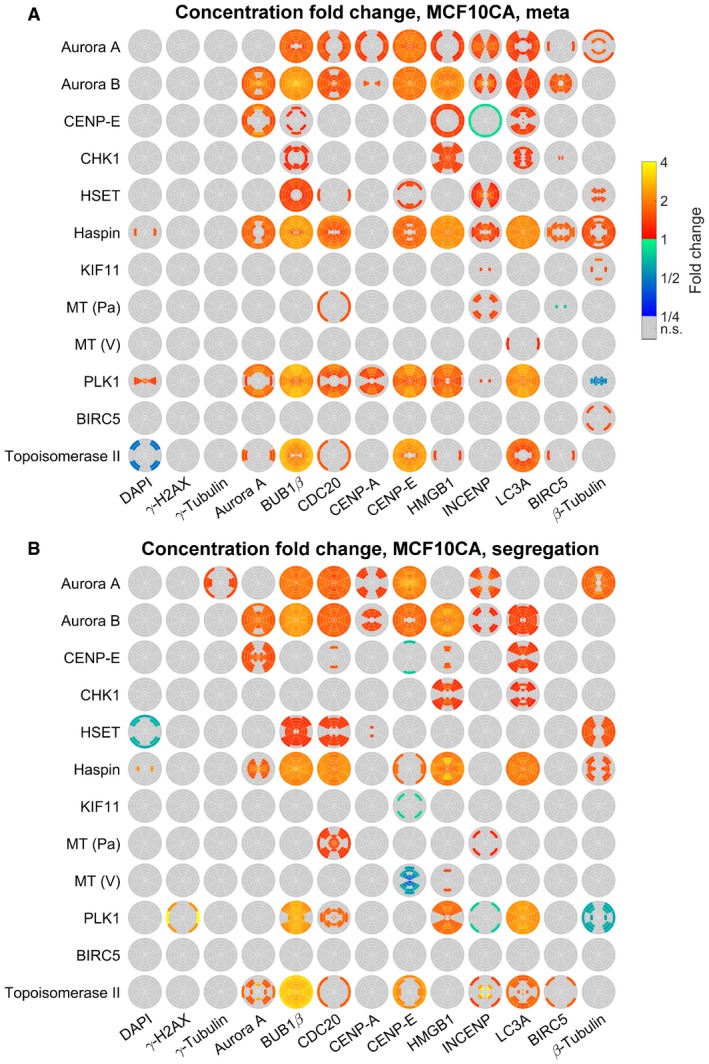
Figure EV4. SpheriCell plots for inhibitor effects in MCF10CA cells.

-
A, BSpheriCell plots indicating concentration fold changes for measured species in metaphase (A) or segregation phase (B) MCF10CA cells treated by 12 inhibitors. Effects were visualized in ROIs with significant effects (Welch's t‐tests performed for 18 ROIs followed by Bonferroni correction, P < 0.05/18).
