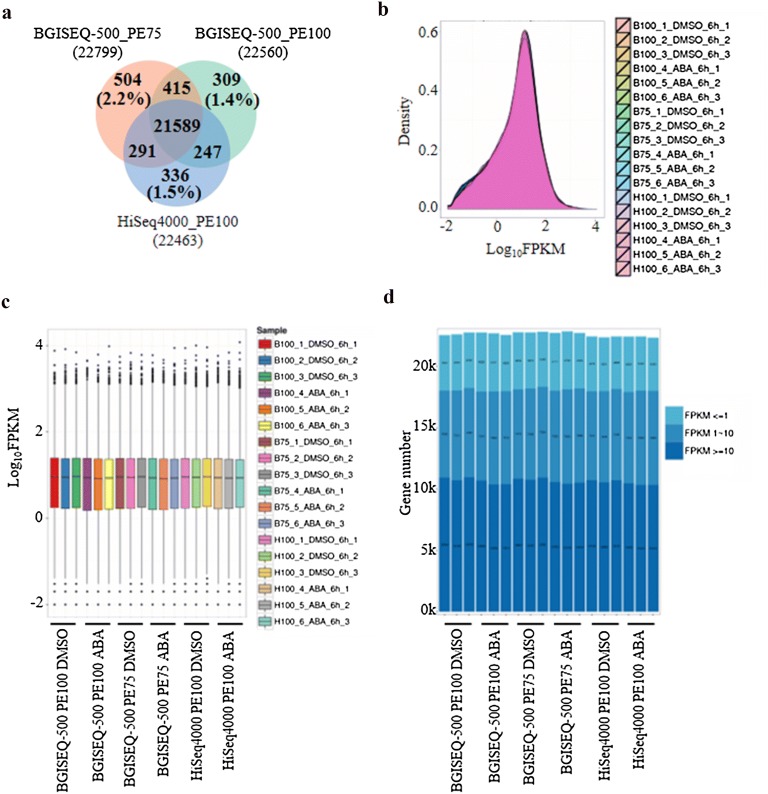
Fig. 3.
Repeatability of gene detection and quantification among three sequencing approaches. a Venn diagram representation of gene detection. Expression density distribution (b), boxplot gene expression graph (c), high and low abundance transcripts quantification (d) for all the replicates tested by three sequencing approaches in this study

