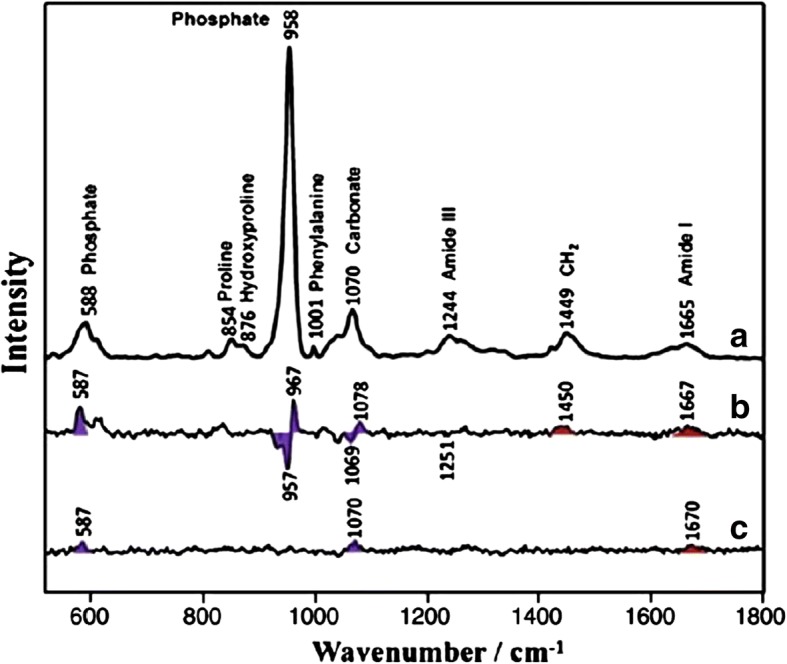
Fig. 2.

Raman spectra of control (a) and Raman difference spectra of [XRT] minus [control] (b) and [AMF] minus [control] (c). Major bands of the mineral are marked with violet shading. Major bands of the matrix are marked with red shading. (Used with permission. Originally published by Tchanque-Fossuo, et al. 2013 in Raman spectroscopy demonstrates Amifostine induced preservation of bone mineralization patterns in the irradiated murine mandible)
