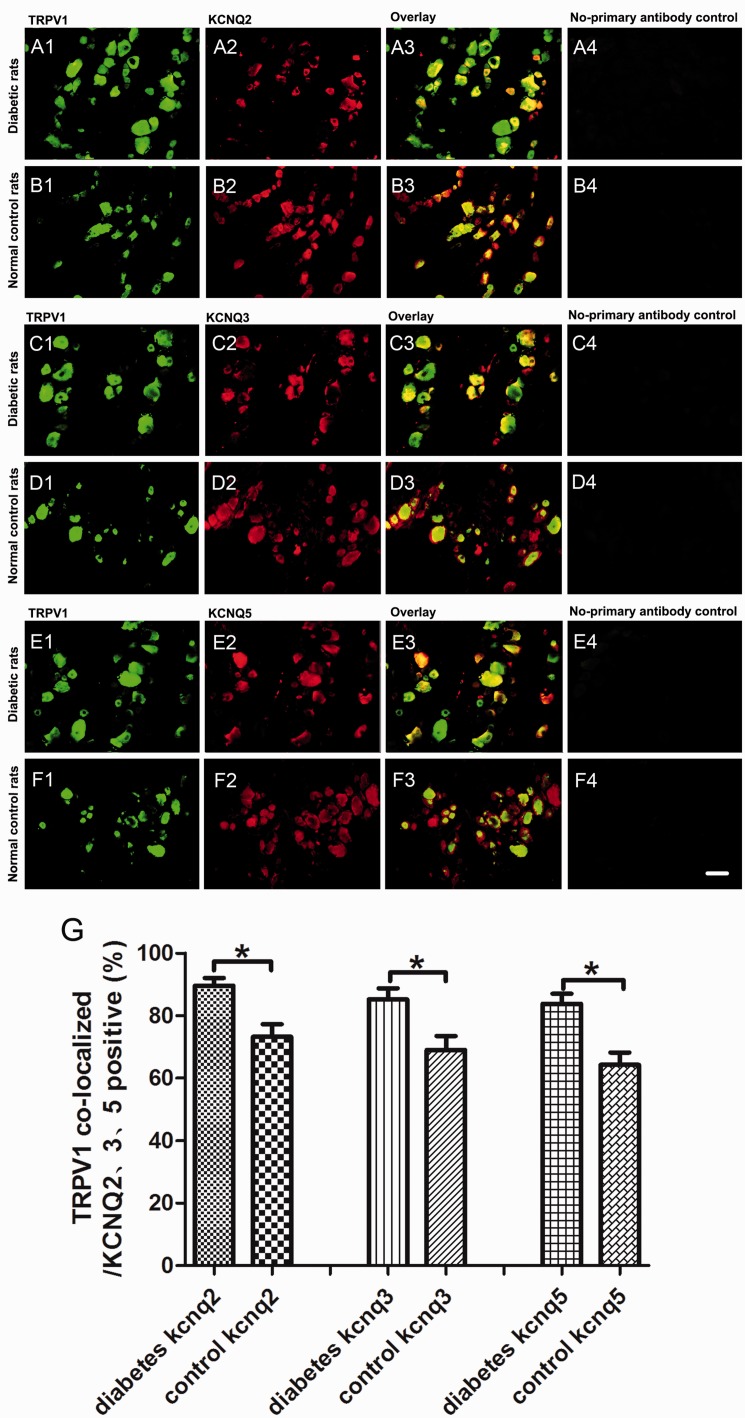
Figure 4.
Increased co-localization of TRPV1 and KCNQ2/3/5 in DRG neurons of neuropathic pain rats. (A1–A4) The examples of TRPV1-positive (green), KCNQ2-positive (red) DRG neurons, overlay, and no-primary antibody control in diabetic rats. (B1–B4) The examples of TRPV1-positive (green), KCNQ2-positive (red) DRG neurons, overlay, and no-primary antibody control in normal control rats. (C1–C4) The examples of TRPV1-positive (green), KCNQ3-positive (red) DRG neurons, overlay, and no-primary antibody control in diabetic rats. (D1–D4) The examples of TRPV1-positive (green), KCNQ3-positive (red) DRG neurons, overlay, and no-primary antibody control in normal control rats. (E1–E4) The examples of TRPV1-positive (green), KCNQ5-positive (red) DRG neurons, overlay, and no-primary antibody control in diabetic rats. (F1–F4) The examples of TRPV1-positive (green), KCNQ5-positive (red) DRG neurons, overlay, and no-primary antibody control in normal control rats. (G) The quantitative analysis of the proportion of TRPV1 co-localized neurons (orange) to KCNQ2/3/5-positive neurons (red). Scale bar = 50 μm. Bar graphs with error bars represent mean ± SEM, n = 5, *P < 0.01, paired Student’s t test. TRPV1: transient receptor potential vanilloid type-1.

