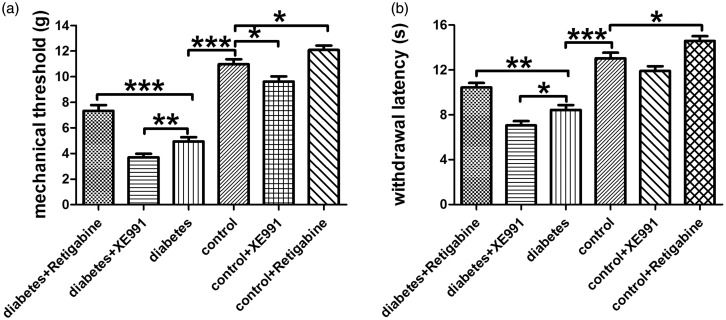
Figure 7.
Paw withdrawal threshold to mechanical and thermal stimulation and drug influence. (a) Paw withdrawal threshold to mechanical stimulation in all groups. (b) Paw withdrawal threshold to thermal stimulation in all groups. Bar graphs with error bars represent mean ± SEM, n=20, *P<0.05, **P<0.01, ***P<0.001, unpaired Student’s t test.

