
Fig. 3.
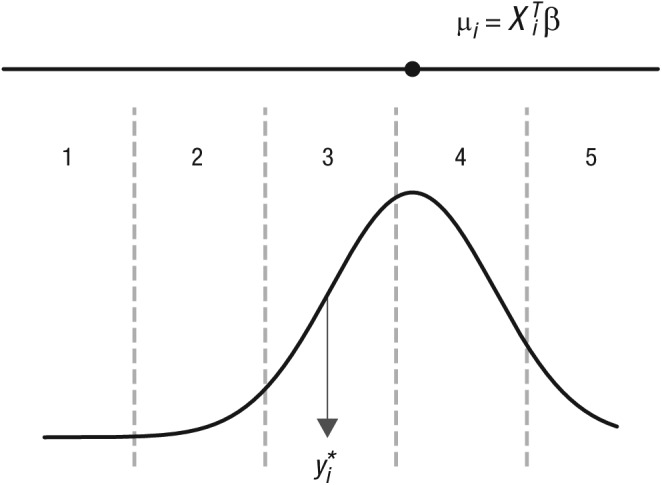
Illustration of an ordered probit model. The upper line represents a continuous latent attainment score. The expected latent attainment score for the ith participant is given by and represented by the position of the black dot on the upper line. A latent attainment score is then sampled from a normal distribution (curved black line) with mean µi and standard deviation σ. The observed attainment score then depends on which of the thresholds C1, . . ., CK–1 (gray dotted lines) falls between. Here, falls between the second and third thresholds, giving an observed attainment score of 3. Note that the threshold parameters will not necessarily be equally spaced.