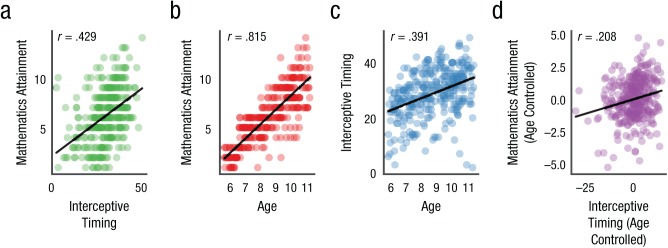
Fig. 4.
Scatterplots (with least-squared regression lines) showing the correlation between (a) mathematics attainment and interceptive timing, (b) mathematics attainment and age, and (c) interceptive timing and age, and the partial correlation between (d) mathematics attainment and interceptive timing after controlling for age. Pearson’s correlation coefficients are given, but these values should be treated with caution because of the ordinal nature of attainment scores (hence reporting of the ordinal probit model elsewhere).

