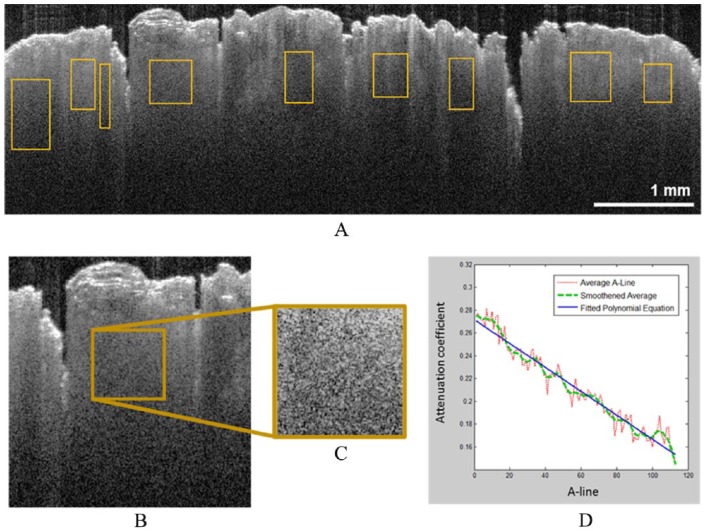
Figure 3.
Attenuation coefficient calculation in OCT images: (A) regions of interest in an OCT image, (B and C) one enlarged region of interest determined in (A) and outlined in brown. (D) Plots from the enlarged region of interest in (B): the average of 100+ A-lines, smoothed average A-line, and the polynomial linear line that is fitted to them. In (D), the OCT signal axis has been normalized, and the depth is represented relative to the true scale of the OCT image in (A). OCT indicates optical coherence tomography.

