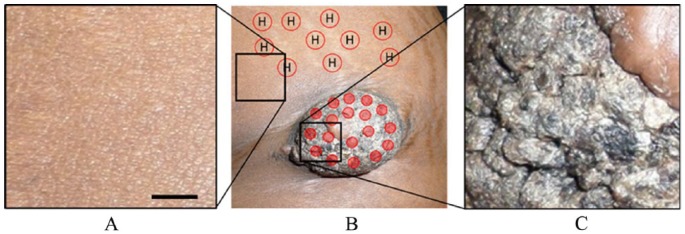
Figure 4.
Photograph showing the GCT lesion in the left iliac region with some healthy regions around it. Photograph of the (A) healthy region indicated in (B) with the black square in left, (B) GCT and some surrounding healthy regions, (C) a part of the GCT indicated in (B) with the right black square. Solid red dots in (B) are the imaging location on the lesion while circles with an “H” represent the healthy skin chosen as a reference. The scale bar is 23 mm. GCT indicates granular cell tumor.

