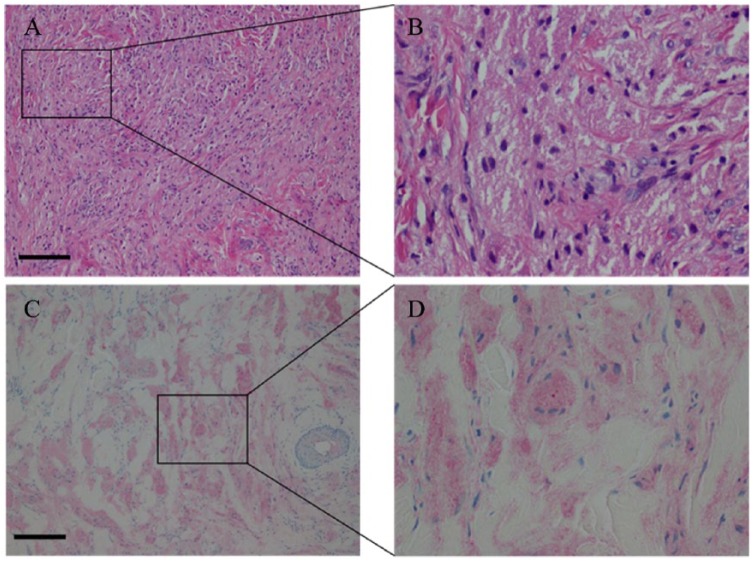
Figure 7.
Histological images of the granular cell tumor corresponding to the lesion depicted in Figure 3. (A) hematoxylin-eosin stain at ×100 magnification, also outlining the region (B) at 400× magnification. The lesional cells containing abundant cytoplasm with tiny eosinophilic cytoplasmic granules and perivascular lymphocytic infiltrate is seen. (C) S-100 stain at ×100 magnification of the same sample, also outlining the region (D) at ×400 magnification. The S-100 stain demonstrates cytoplasmic and nuclear positivity. The scale bar is 65 µm.

