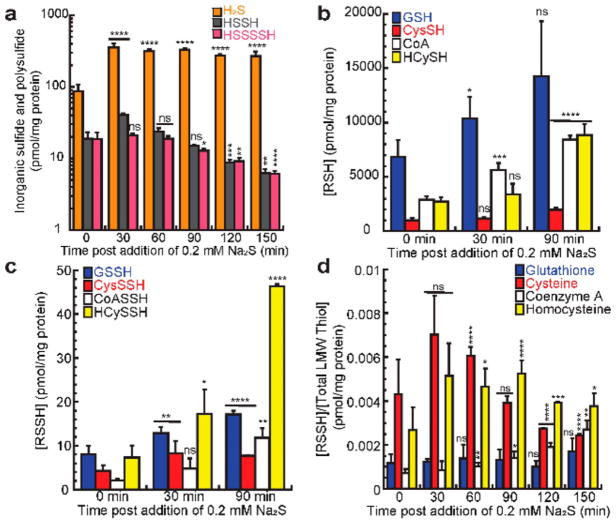
Figure 3.
LMW inorganic species and organic thiol and persulfide concentrations for wild-type E. faecalis strain OG1RF following induction of the cst-like operon at t = 0 by 0.2 mM Na2S. (a) Level changes of inorganic species H2S (orange), HSSH (gray), and HSSSSH (pink). (b) Level changes of reduced glutathione (GSH, blue), cysteine (CysSH, red), CoA (white), and homocysteine (HCySH, yellow). (c) Level changes of glutathione (GSSH, blue), cysteine (CysSSH, red), CoA (CoASSH, white), and homocysteine (HCySSH, yellow) persulfides. (d) Ratio of persulfide to total cellular LMW thiol of glutathione (blue), cysteine (red), CoA (white), and homocysteine (yellow). Values represent mean ± SD of the mean derived from results of triplicate experiments with statistical significance established using a paired t test relative to wild-type strain under the same conditions (****p ≤ 0.0001, ***p ≤ 0.001, **p ≤ 0.01, *p ≤ 0.05; ns, no significant difference). For endogenous levels (t = 0), values represent means ± SD from n = 12 measurements, and values outside one standard deviation of the mean were excluded in final mean and standard deviation calculations. Additional time points for these conditions and cellular concentrations of wild-type E. faecalis strain OG1RF stressed with 0.4 mM Na2S are found in Figures S2 and S4.

