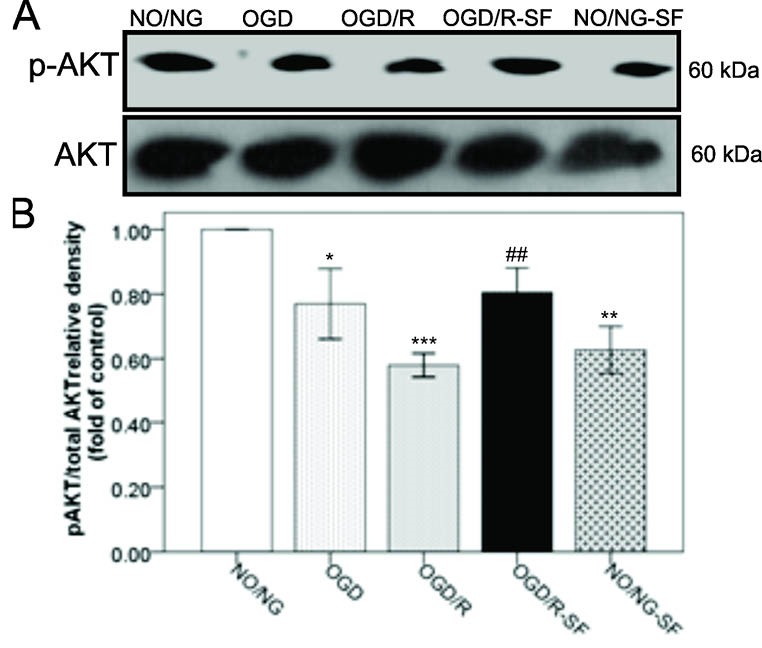
Figure 1.

The effect of SF1670 on AKT phosphorylation in PC12 cell exposed to OGD/R. A) Immunoblotting images of p-AKT and total AKT proteins in PC12 cells exposed to one hour OGD followed by 6 h of reperfusion and/or 10µM SF1670 pretreatment. B) Quantitative densitometric analysis of the p-AKT against total AKT protein bands. Data are presented as means ± SEM. *P <0.05, **P < 0.01, ***P < 0.001 vs. NO/NG. ##P < 0.01 vs. OGD/R. [NO/NG: normoxic/normoglycemic cells; OGD: Oxygen and glucose deprived cells (60 min); R: Reperfused cells for 6 hours; SF: SF1670 (10 µM) treated cells with SF1670 one hour before OGD].
