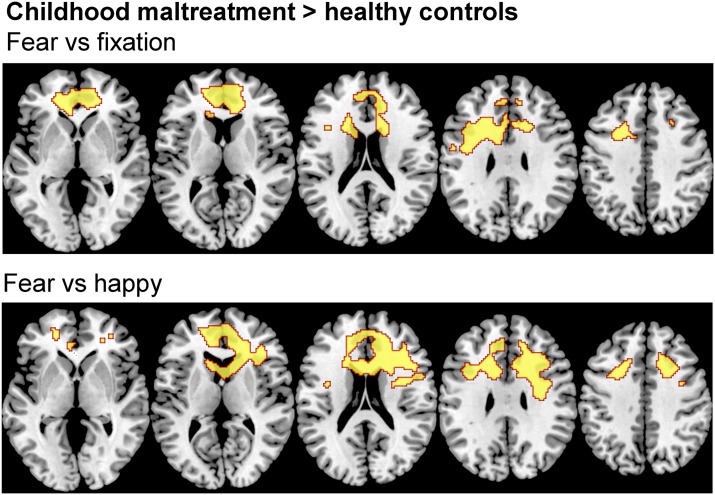
Fig. 2.
Between-group differences in brain activation for whole-brain analyses of fear v. happy and fear v. fixation contrasts. Thresholds were p < 0.05 family-wise error rate-corrected. Z coordinates represent distance from the anterior-posterior commissure in millimetres. The right side of the image corresponds to the right side of the brain.

