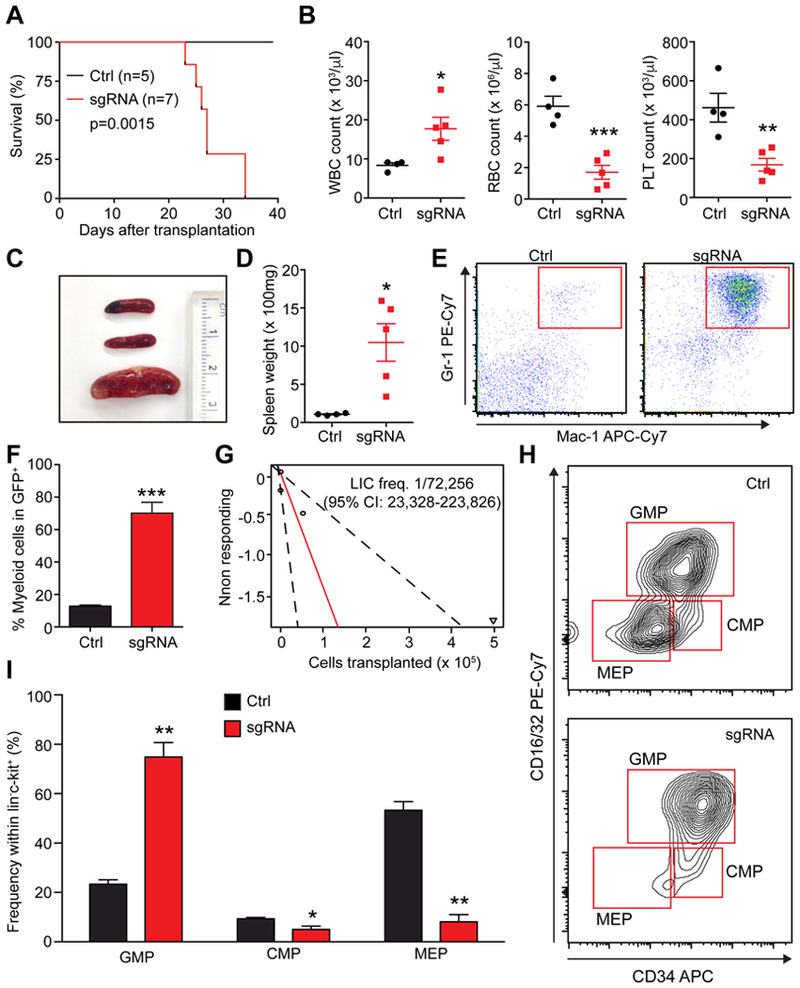
Figure 4. Generation of LICs by CRISPR/Cas9-mediated gene editing.

(A) Survival curves of mice receiving 5 × 10⁶ whole bone marrow cells that were collected from primary AML mouse (sgRNAs) and control mice (Ctrl) (p=0.0015, log-rank test) (n=5 for ctrl and n=7 for leukemia mice). (B) Comparison of white blood cell (WBC), red blood cell (RBC), and platelet (PLT) numbers in secondary recipients (n=4–5). (C) A representative image of the spleens from control recipients (top two) and AML recipients (bottom). (D) Quantification of the spleen weight of control and AML recipient mice (n=4–5). (E) Representative flow cytometry plots showing expansion of myeloid cells in the spleens of AML recipient mice compared to control recipient mice (n=5). (F) Quantification of the frequencies of myeloid cells relative to the entire donor-derived GFP+ fraction in secondary recipient mice (n=5). (G) Limiting dilution assay demonstrated that the LIC frequency in whole bone marrow of primary AML mouse was about 1 in 72,000 (n=5 recipient mice per cell dose). (H) Representative flow cytometry plots showing expansion of GMPs, while CMPs and MEPs were depleted in AML mice. (I) Quantification of the results shown in (H) (n=5). All data represent mean±SEM; *, p<0.05; **, p<0.01; ***, p<0.001 by Student’s t-test.
