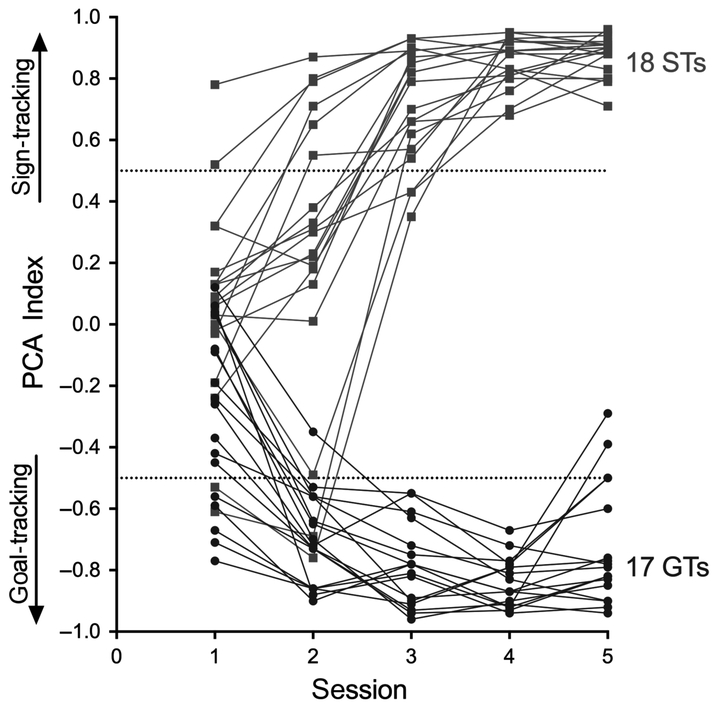
Fig. 1.
Individual PCA index values across five PCA training sessions. The final classification of ST (n = 18) or GT (n = 17) phenotype was based on averaging PCA index values from sessions 4 and 5. The pre-determined PCA index score cutoffs for STs and GTs were 0.5 and −0.5, respectively. [Colour figure can be viewed at https://wileyonlinelibrary.com].

