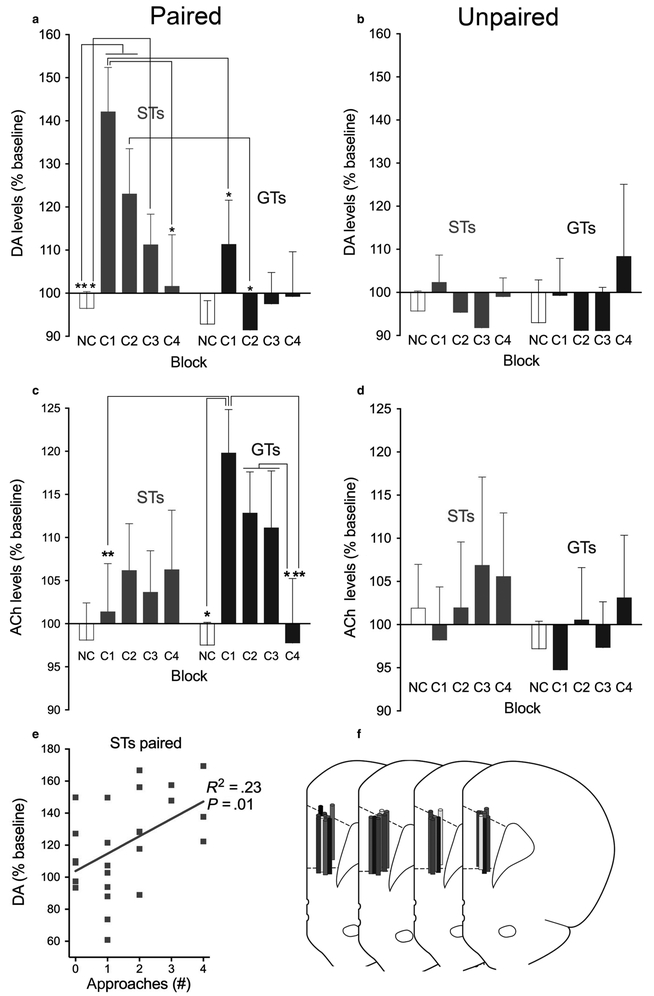
Fig. 5.
Medial prefrontal DA (a,b) and ACh (c,d) levels in paired (a,c) and unpaired (b,d) STs and GTs. One dialysate each was obtained during four 4-min blocks during which the cue was presented (C1–C4), and these blocks were separated by 8-min blocks without cues (NC, data from NC blocks were averaged to yield one data point per condition; note that because of occasional failures to analyse DA or ACh in individual samples, the number of data points per condition varied across neurotransmitters; DA: paired STs, n = 7; paired GTs, n = 5; unpaired STs, n = 5; unpaired GTs, n = 3; ACh: paired STs, n = 10; paired GTs, n = 6; unpaired STs, n = 7; unpaired GTs, n = 6). Cue presentations increased DA levels in STs but not GTs, and ACh levels in GTs, but not STs. In unpaired rats, DA and ACh levels during C1–C4 did not differ from levels seen during NC blocks (M, SEM; multiple comparisons: *P < 0.05; **P < 0.01). (e): In paired STs, individual prefrontal DA levels and approach rates were significantly correlated. No such correlations between approach rates and DA levels were found in paired GTs or unpaired animals, and neither were approach rates correlated with ACh levels in any group of rat (not shown). (f) Placement of the microdialysis probes in the prelimbic cortex (AP level +3.0 mm relative to Bregma) for animals for which dialysate levels were successfully measured. Probe placement is indicated on separate sections for each experimental group for better visualization (left to right: STs paired (n = 10), STs unpaired (n = 7), GTs paired (n = 6), GTs unpaired (n = 7)). [Colour figure can be viewed at https://wileyonlinelibrary.com].

