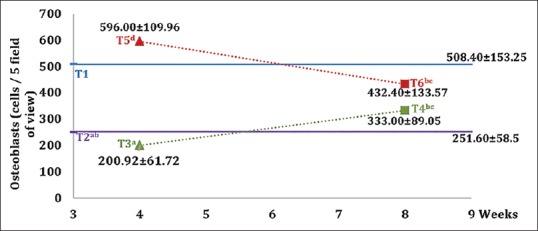
Figure 6.

Graph of mean values and standard deviation of each group on the osteoblasts. Different superscripts show a statistically significant difference (P < 0.05)

Graph of mean values and standard deviation of each group on the osteoblasts. Different superscripts show a statistically significant difference (P < 0.05)