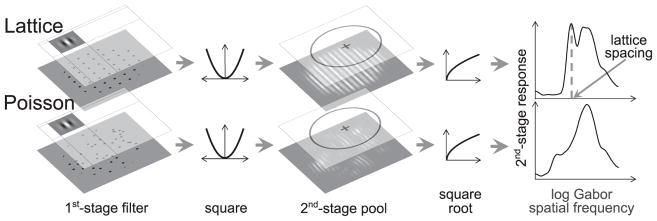
Figure 1.
Demonstration of the filter-rectify-filter process for two dot patterns. The top row demonstrates the process for a perfectly regular pattern and the bottom row for a Poisson pattern. The dot pattern was convolved with a series of Gabor filters of varying spatial scale. The outputs were squared and pooled across a fixed circular area and then a final square root nonlinearity was applied. Comparing the two spectra, one can see the narrow peak that corresponds to the lattice spacing in the upper-right graph; this peak is absent for the Poisson pattern.

