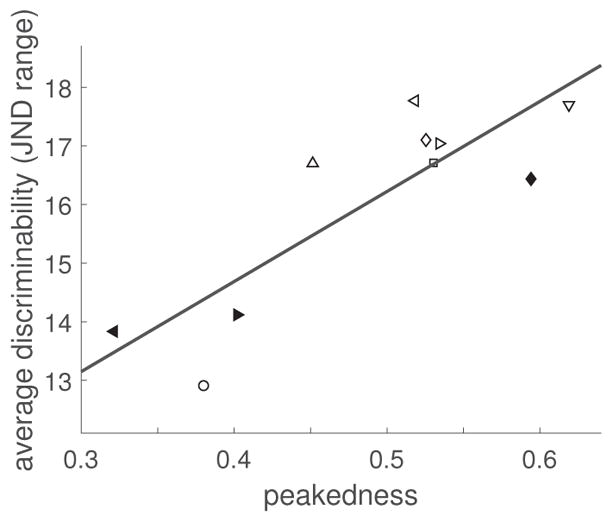
Figure 14.

Expt. 2: Linear fit to discrimination performance as a function of peakedness. Non-filled symbols: Conditions of Groups A and B. Filled symbols: Group C-only conditions. Circle: Condition 1. (Symbol correspondence to conditions is consistent with Figures 12 and 13.)
