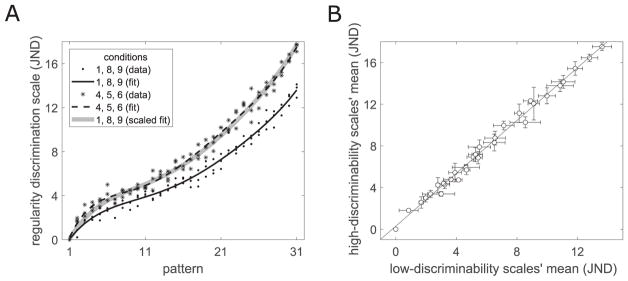
Figure 15.
Comparison of the disciminability scales for strong- and poor-performance conditions across the entire range of regularity. (A) Combined discrimination scales and polynomial fits for conditions of low (1, 8, 9) and high (4, 5, 6) discriminability. A rescaled polynomial fit of the low-discriminability conditions coincides almost perfectly with the polynomial fit to the high-discriminability conditions. (B) Scatterplot and linear fit of the means of the low- vs. high-discriminability scale values (error bars show standard deviation for the three values for each pattern number).

