Figure 3.

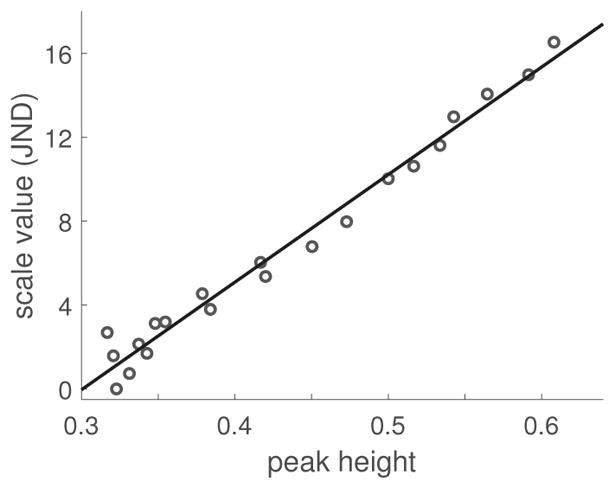
Discrimination scale values from Thurstonian scaling vs. height of the peak at the spatial frequency corresponding to the lattice periodicity in the distribution of responses across scale. Data from Protonotarios and colleagues (2016).

Discrimination scale values from Thurstonian scaling vs. height of the peak at the spatial frequency corresponding to the lattice periodicity in the distribution of responses across scale. Data from Protonotarios and colleagues (2016).