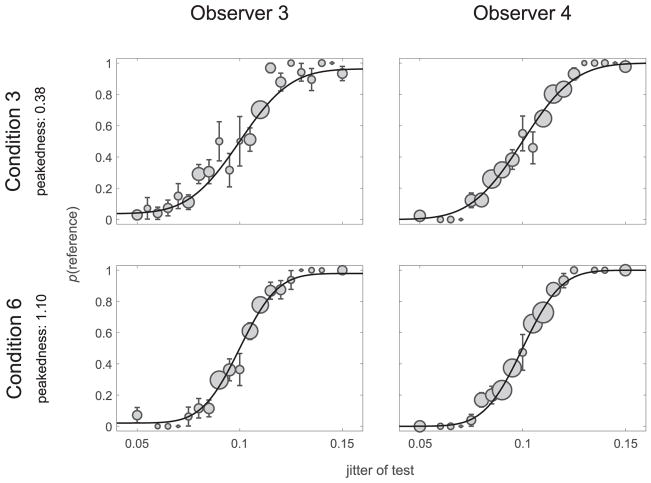
Figure 7.
Experiment 1 results. Psychometric curves and data for observers 3 and 4 in conditions 3 (top) and 6 (bottom). The condition with higher peakedness (condition 6) also has steeper slope (i.e., higher sensitivity). Dot area is proportional to the number of trials per datapoint. Error bars: ±1 standard error.

