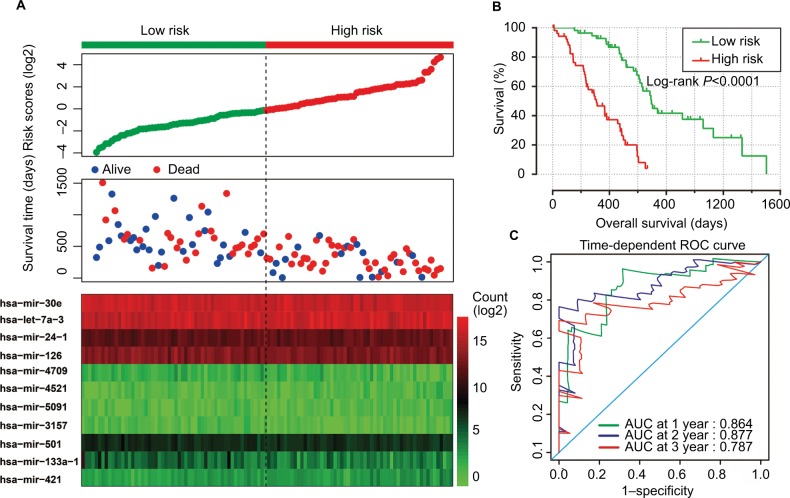
Figure 2.
Prognostic risk score model analysis of 11 prognostic miRNAs in PDAC patients.
Notes: (A) From top to bottom are the risk score, patients’ survival status distribution, and 11 prognostic miRNA expression heat maps for low- and high-risk groups. (B) Kaplan–Meier curves for low- and high-risk groups. (C) ROC curve for predicting survival in PDAC patients by the risk score.
Abbreviations: miRNA, microRNA; PDAC, pancreatic ductal adenocarcinoma; ROC, receiver operating characteristic; AUC, area under curve.

