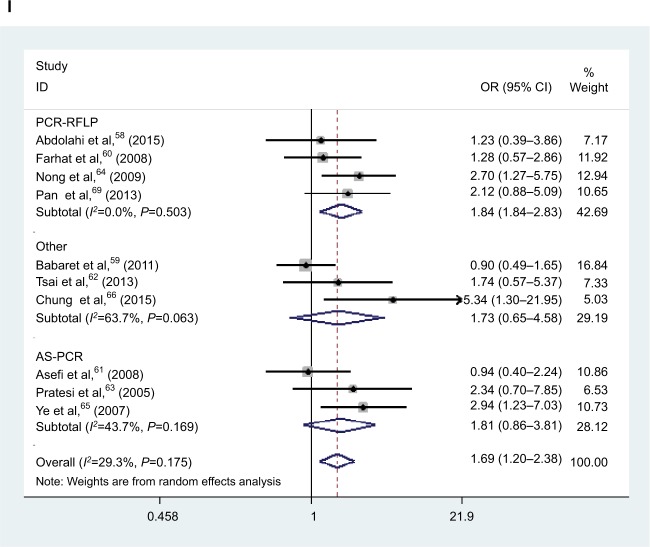
Figure 2.
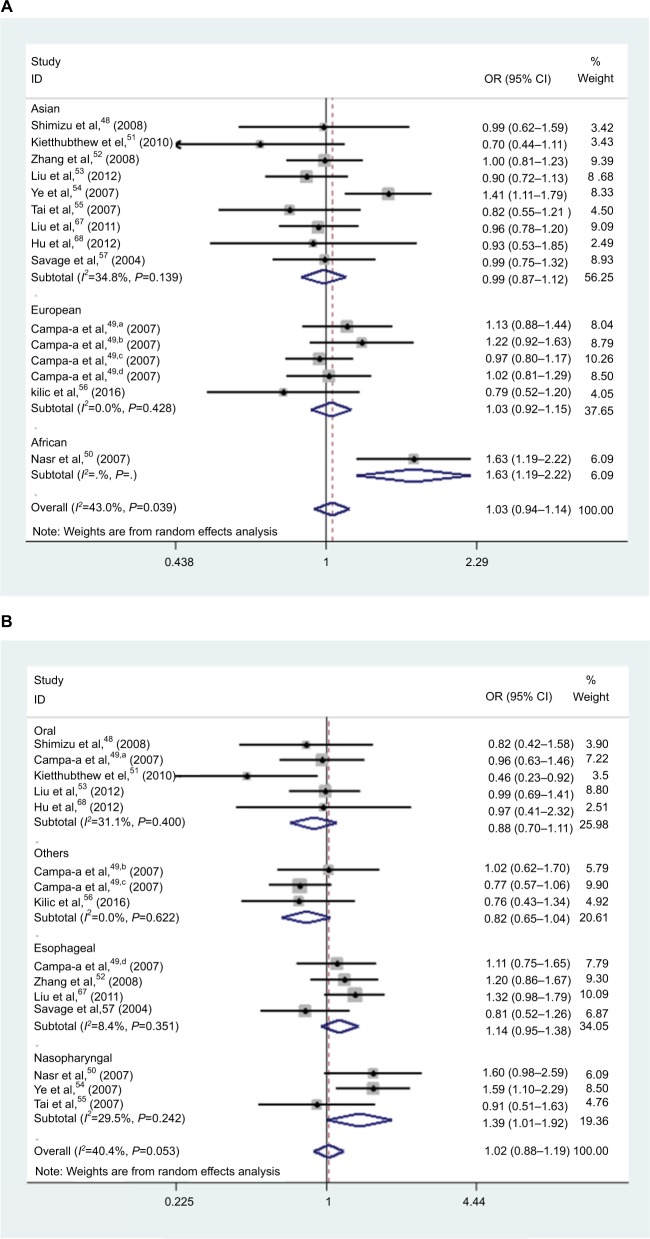
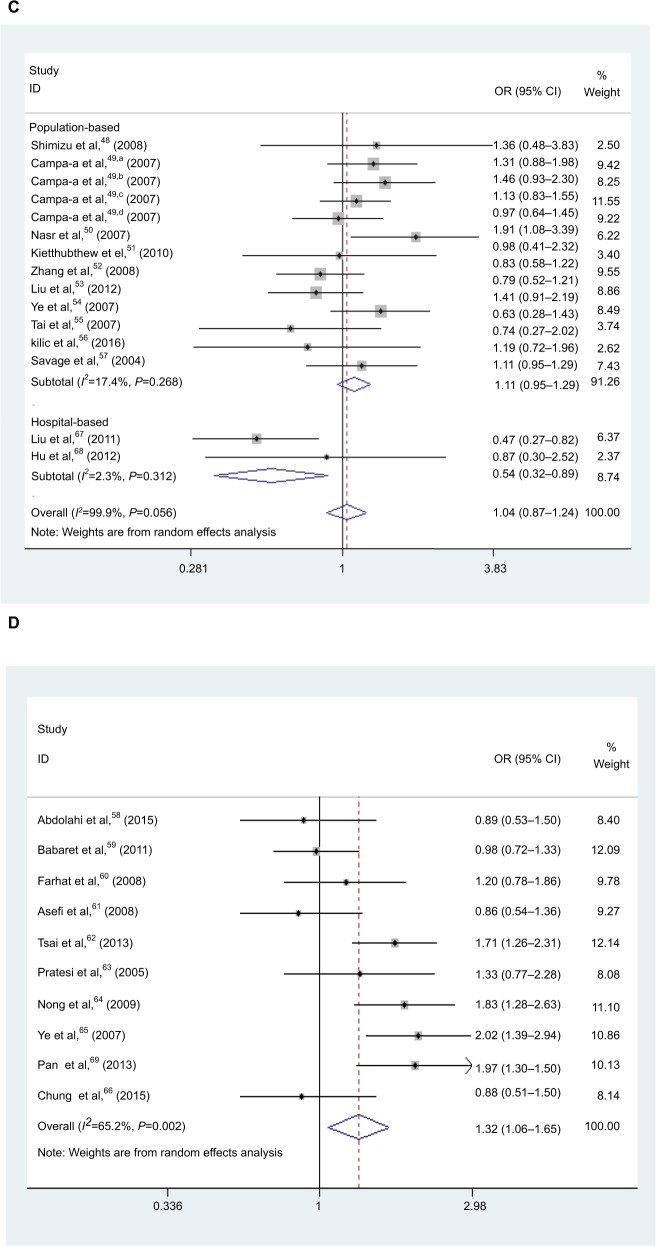
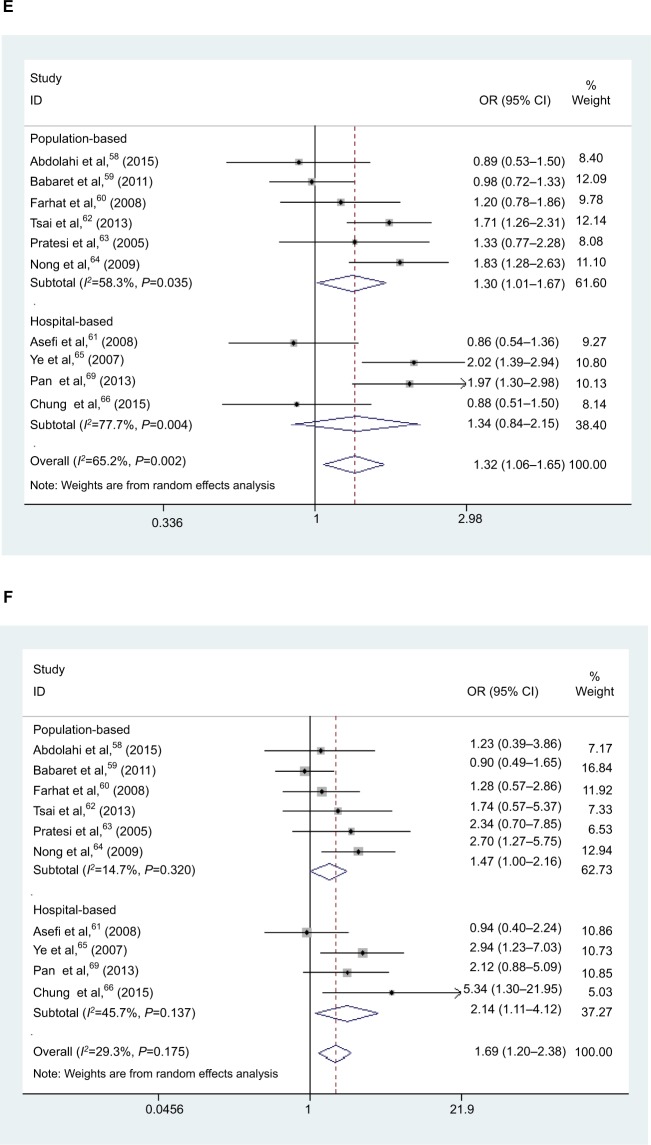
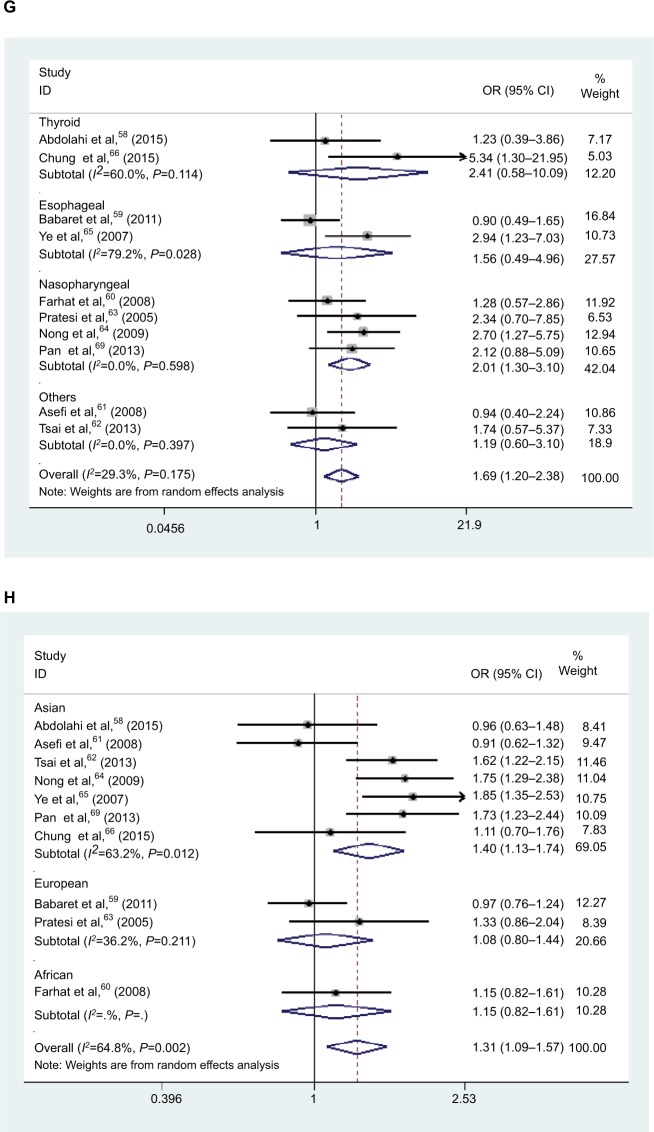
Forest plot of HNC risk associated with polymorphism if CXCL8 −251 A/T and IL-18 −137 G/C. (A) Forest plot of association between CXCL8 −251 A/T polymorphism and HNC risk in A vs T model in ethnicity. (B) Forest plot of association between CXCL8 −251 A/T polymorphism and HNC risk in AT vs TT model in cancer type. (C) Forest plot of association between CXCL8 −251 A/T polymorphism and HNC risk in AA vs AT/TT model in source of control. (D) Forest plot of association between IL-18 −137 G/C polymorphism and HNC risk in GC/CC vs GG model in overall analysis. (E) Forest plot of association between IL18 137 G/C polymorphism and HNC risk in GC/CC vs GG model in source of control. (F) Forest plot of association between IL-18 −137 G/C polymorphism and HNC risk in CC vs GG model in source of control. (G) Forest plot of association between IL-18 −137 G/C polymorphism and HNC risk in CC vs GG model in cancer type. (H) Forest plot of association between IL-18 −137 G/C polymorphism and HNC risk in G vs C model in ethnicity. (I) Forest plot of association between IL-18 −137 G/C polymorphism and HNC risk in CC vs GG model in genotyping methods.
Abbreviations: HNC, head and neck cancer; OR, odds ratio; CI, confidence interval.

