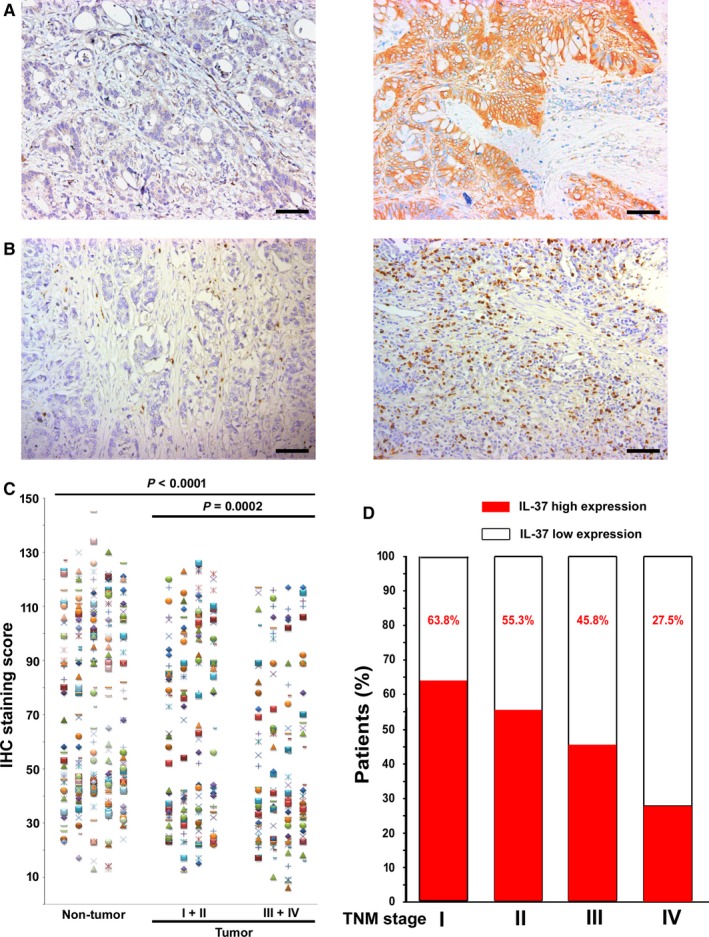
Figure 1.

IL‐37 Expression in CRC Tissues. A and B, Representative IHC images of IL‐37 and CD66b expression in tumor tissue, left panel: low IL‐37and CD66b expression, right panel: high IL‐37 and CD66b expression. C, Scatter plots for IHC staining score in unpaired nontumor tissue (n = 337) and tumor tissue (n = 337) from the training cohort. P value was determined using the nonparametric Mann‐Whitney test. D, Percentage of patients with high intratumoral IL‐37 expression increased moderately with disease progression from TNM stage I‐IV (n = 582, data from the training and validation cohort). Scale bar, 100 μm
