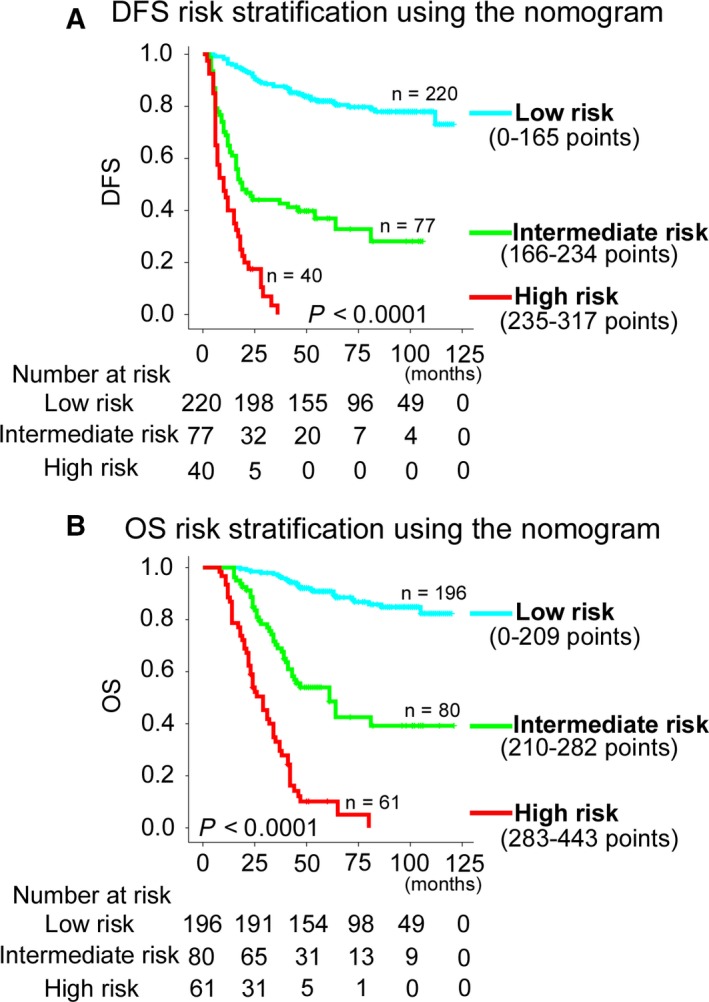
Figure 6.

Kaplan‐Meier Survival Analysis of OS and DFS According to Three risk Groups in the Training Cohort. The entire population was divided in three subgroups according to the total number of points given by the nomograms. A, DFS nomogram. B, OS nomogram
