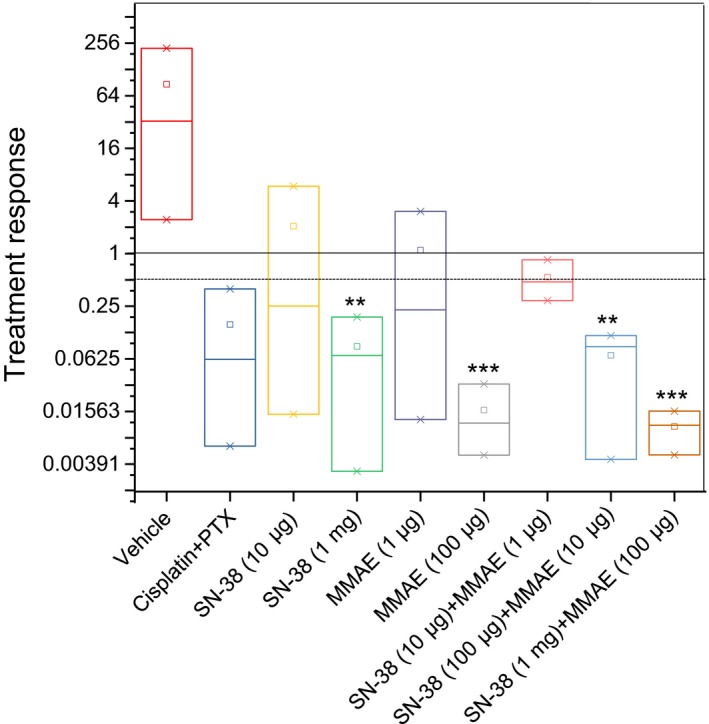
Figure 4.

Box‐and‐whisker plot showing median (minimum‐maximum) and treatment response (total flux at the end of treatment/total flux before treatment). Data are presented as mean ± SD (n = 3). Statistics were computed by the paired t test (prior to vs. last treatment). *, **, and ***indicate P‐values <.05, <.01 and <.001, respectively
