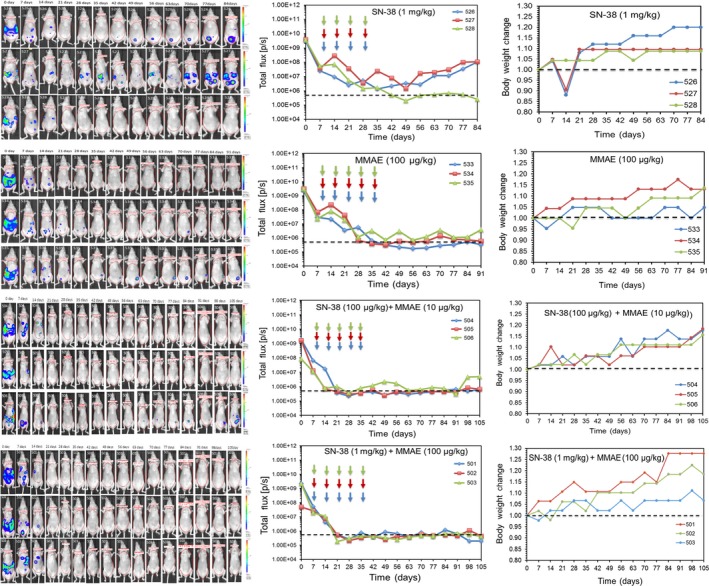
Figure 5.

Evaluation of disease progression, recurrence and body weight change in the four treatment groups that responded to therapy. The dashed lines indicate the background mouse body bioluminescence which was determined to be 5 × 10⁵. Arrows indicate the days that mice received the drug treatments (ie days 8, 15, 22, 29, and 36)
