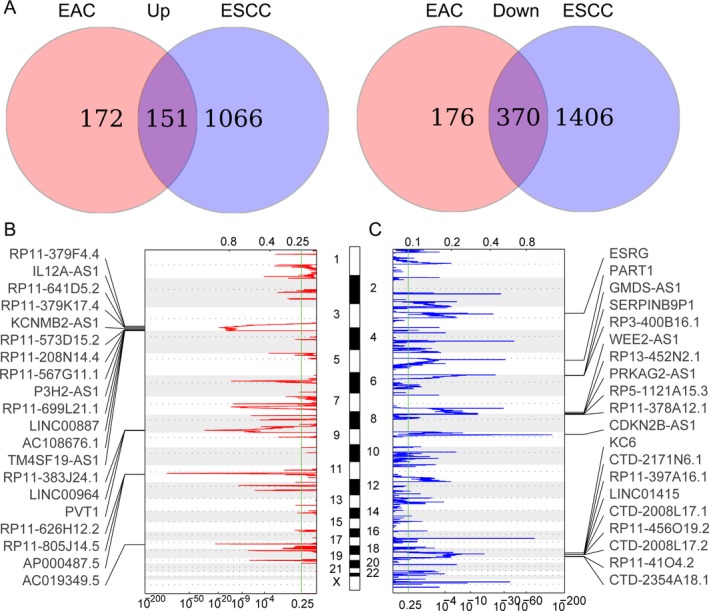
Figure 2.

The copy number variations (CNV) of lncRNAs genomic loci in esophageal cancer. A, Venn diagram of dysregulated lncRNAs profiling in esophageal adenocarcinoma (EAC) and esophageal squamous cell carcinoma (ESCC). B, Frequency of lncRNAs genome loci copy number gain (red) in esophageal cancer tissues (top20). Each row represents an lncRNA locus, and all the rows are arranged according to the lncRNAs genomic locations. C, The frequency of lncRNAs genome loci copy number loss (blue) in esophageal cancer tissues (top20). Each row represents an lncRNA locus, and all the rows are arranged according to the lncRNAs genomic locations
