
Figure 3.
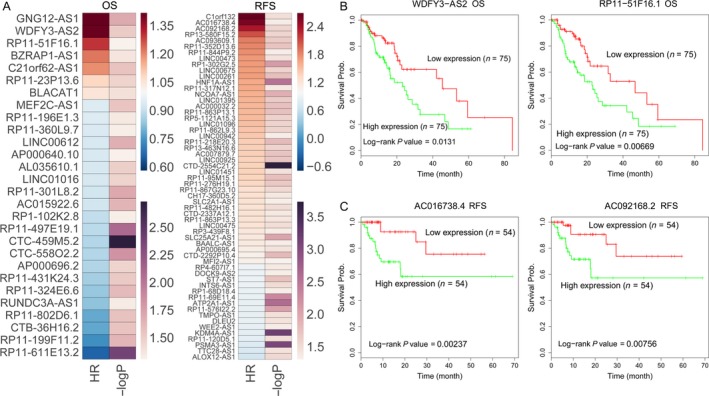
OS and RFS associated lncRNAs in esophageal cancer. A, Heat maps were drawn to show the log‐rank P and hazard ratio values of OS and RFS associated lncRNAs in esophageal cancer using TCGA clinical data. B, The Kaplan‐Meier curves show the OS of esophageal cancer patients with higher or lower WDFY3‐AS2, and RP11‐51F16.1PVT1 in the TCGA data. C, The Kaplan‐Meier curves for esophageal cancer patients RFS in higher or lower AC016738.4, and AC092168.2 groups in the TCGA data were examined by two‐sided log‐rank test