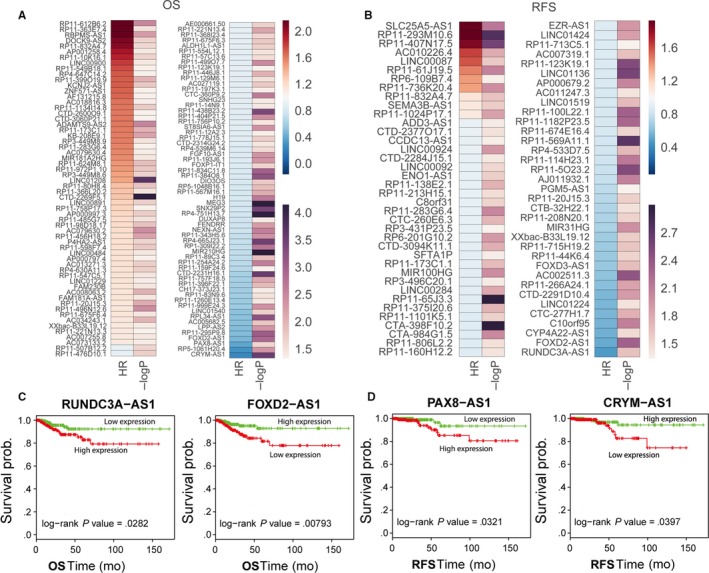
Figure 3.

Analysis of thyroid cancer patients’ OS‐ and RFS‐associated lncRNAs. A, B, Heatmaps were drawn to show the log rank P value and hazard ratio value of OS and RFS‐associated lncRNAs in thyroid cancer. C, The Kaplan‐Meier curves for thyroid cancer patients’ OS in high‐RUNDC3A‐AS1 or FOXD‐AS1 and low‐RUNDC3A‐AS1 or FOXD‐AS1 groups in the TCGA set. The significant differences between two groups were determined using the two‐sided log‐rank test. D, The Kaplan‐Meier curves for thyroid cancer patients’ RFS in high‐PAX8‐AS1 or CRYM‐AS1and low‐PAX8‐AS1 or CRYM‐AS1groups in the TCGA set
