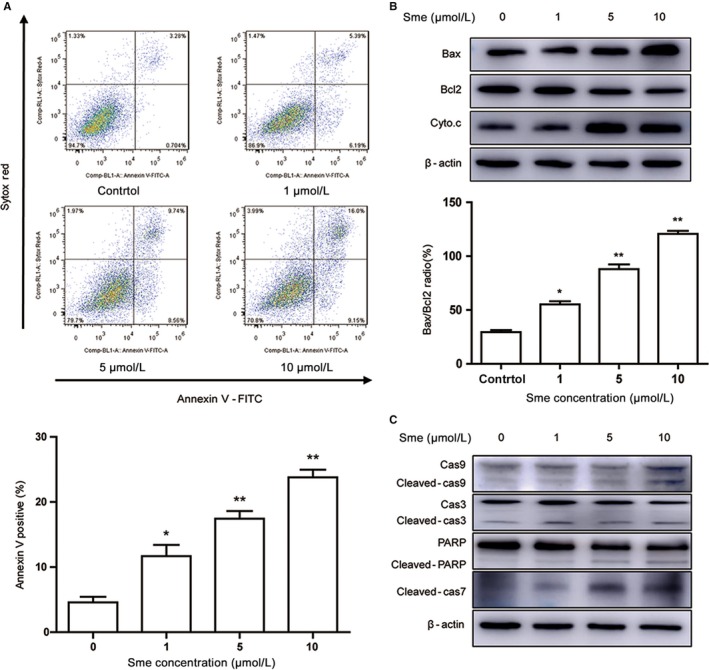
Figure 4.

Sme induces apoptosis in MCF7‐Nanog cells. A, Cells were treated with different concentrations of Sme for 36 hours. The apoptotic cells were measured and quantified by flow cytometry using Annexin V‐FITC/Sytox Red staining. B, The expression of Bcl2, Bax, and Cyto.c were detected by western blotting analysis after exposure to Sme for 36 hours, with β‐actin as a loading control. The bar graph represents the ratio of Bax/Bcl2 at the protein levels. Data were expressed as mean ± SD of three experiments. * P < .05, ** P < .01. C, The expression of caspase‐9, caspase‐3, caspase‐7, and PARP were detected by western blotting analysis after exposure to Sme for 36 hours, with β‐actin as a loading control
