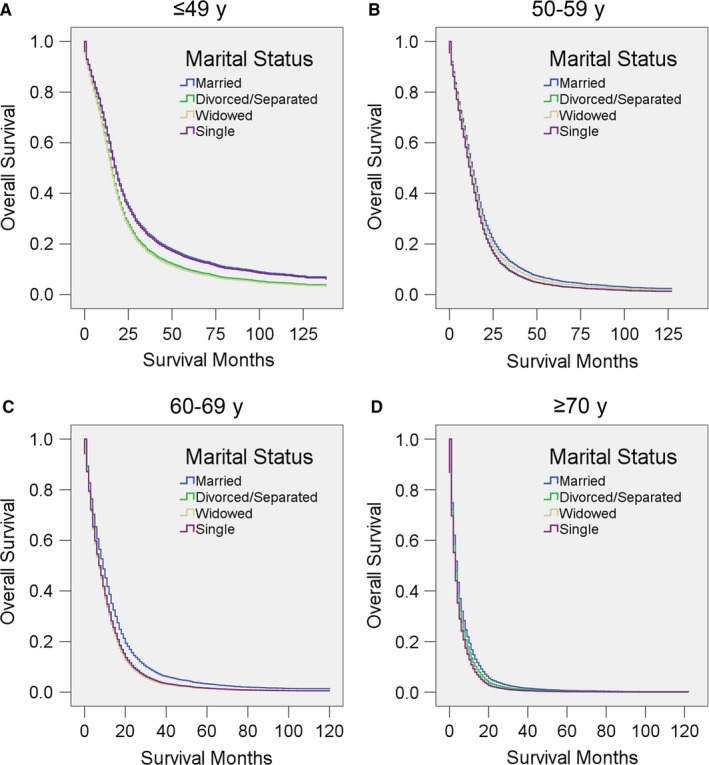
Figure 3.

Survival curves for GBM patients according to marital status in different age range. Cox regression analyses for overall survival in patients aged A, ≤49, B 50‐59, C, 60‐69, and D, ≥70 years

Survival curves for GBM patients according to marital status in different age range. Cox regression analyses for overall survival in patients aged A, ≤49, B 50‐59, C, 60‐69, and D, ≥70 years