
Figure 6.
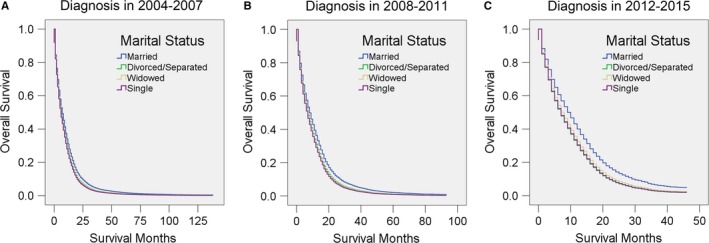
Survival curves for GBM patients according to marital status in different years of diagnosis. Cox regression analyses for the overall survival of patients diagnosed in A, 2004‐2007, B, 2008‐2011, and C, 2012‐2015
Official websites use .gov
A
.gov website belongs to an official
government organization in the United States.
Secure .gov websites use HTTPS
A lock (
) or https:// means you've safely
connected to the .gov website. Share sensitive
information only on official, secure websites.
Survival curves for GBM patients according to marital status in different years of diagnosis. Cox regression analyses for the overall survival of patients diagnosed in A, 2004‐2007, B, 2008‐2011, and C, 2012‐2015