
Figure 7.
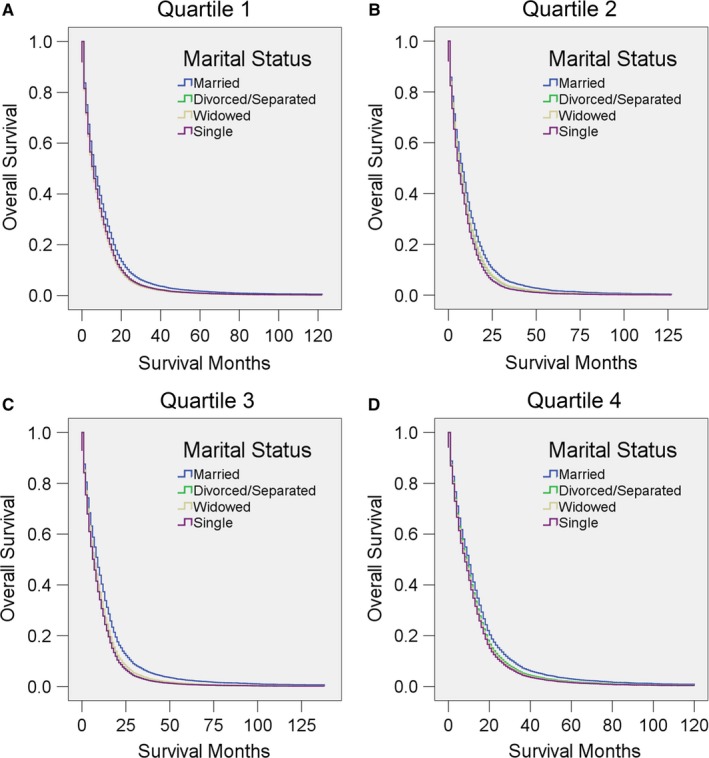
Survival curves for GBM patients according to marital status for different local education levels (defined as the percentage of the local population with at least a bachelors’ degree). Cox regression analyses for overall survival in A, quartile 1, B, quartile 2, C, quartile 3, and D, quartile 4