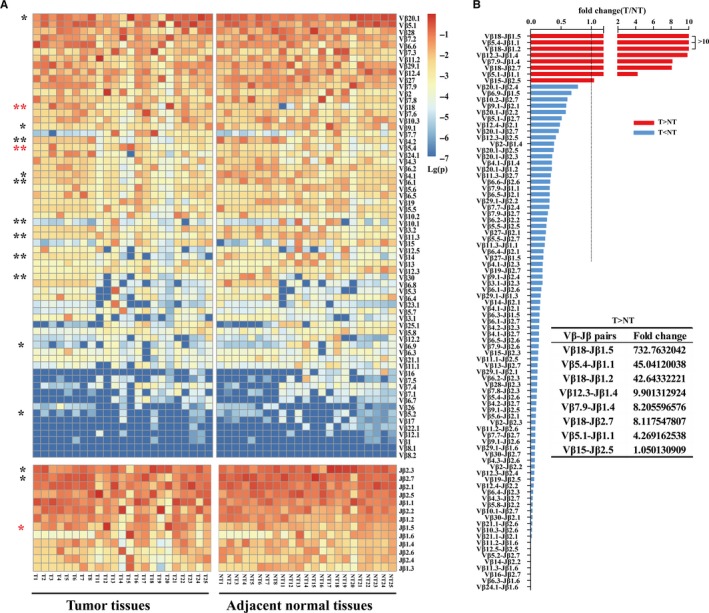
Figure 1.

The usage of Vβ, Jβ, and Vβ‐Jβ paired genes in tumor tissues and paired adjacent normal tissues. A, Heat map of the usage frequency of Vβ and Jβ genes. *P < .05 and **P < .01 by two‐tailed paired t‐tests. Several Vβ or Jβ usage frequencies were significantly higher (red star) or lower (black star) in tumor tissue than paired adjacent normal tissue. B, The Vβ‐Jβ paired genes with significantly difference on usage frequency between paired tissues. Fold change was calculated by the usage frequency in tumor tissue divided by the usage frequency in paired adjacent normal tissue. T, tumor tissue; NT, paired adjacent normal tissue
