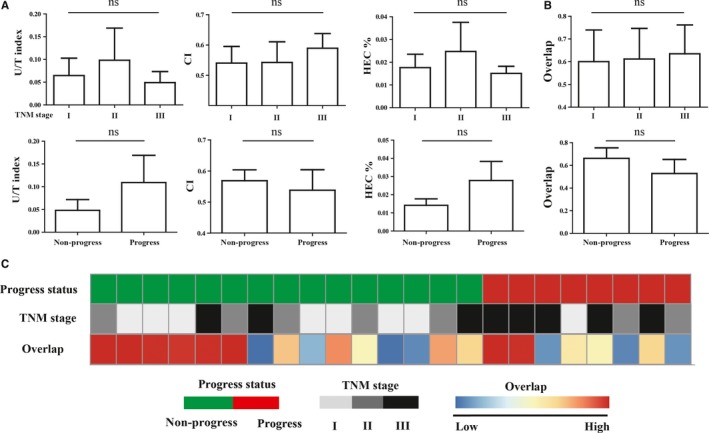
Figure 3.

Analysis of the relation between TCR repertoire and clinical data. A, Comparison of TCR repertoire diversity in tumor tissues among different groups. B, Comparison of TCR repertoire similarity of paired samples among different groups. TCR repertoire overlap between paired samples was calculated by overlap. C, Heat map associations of TCR repertoire similarity and clinical information in 23 patients. TNM stages (I, n = 8; II, n = 7; III, n = 8). Disease progress group (n = 8) and non‐progress group (n = 15). ns indicates not significant difference
