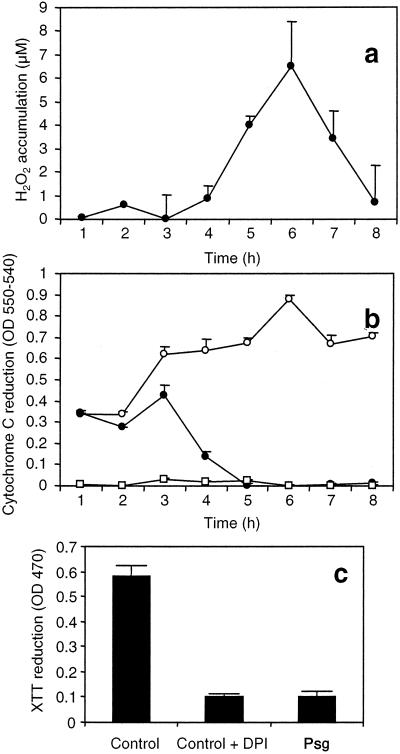
Figure 5.
ROI accumulation in soybean cells agitated at 90 rpm. (A) Kinetics of H2O2 accumulation in response to P. syringae pv. glycinea carrying avrA. (B) Kinetics of O2− accumulation measured by cytochrome c reduction in response to P. syringae pv. glycinea carrying avrA (●), unchallenged cells (○), and unchallenged cells + 10 μM diphenylene iodonium (□). (c) Cumulative O2− accumulation 24 h postinoculation with P. syringae pv. glycinea carrying avrA (Psg) measured by XTT reduction. Each datum point is the mean and standard deviation of three replicates. Experiments were repeated three times with similar results.

