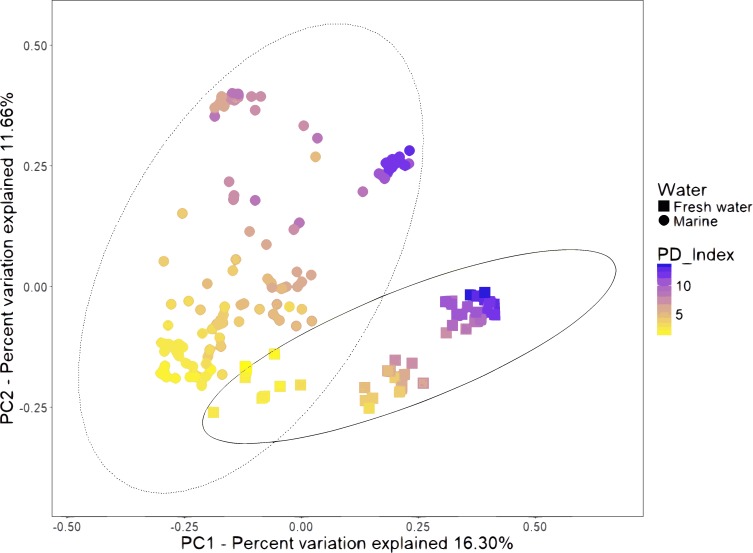
Figure 2. Beta diversity analysis of microbiota samples from freshwater and marine shrimps.
Unweighted principal coordinate analysis (PCoA) of UniFrac distances for samples tagged by marine or freshwater origin. The color gradient shows the value of the Phylogenetic Diversity index (PD). The ellipses represented the normal distribution with a confidence level = 0.95 for each group.

