
Extended Data Figure 1. Cell-wall deformation is approximately linear with respect to hyperosmotic shock over a large range.
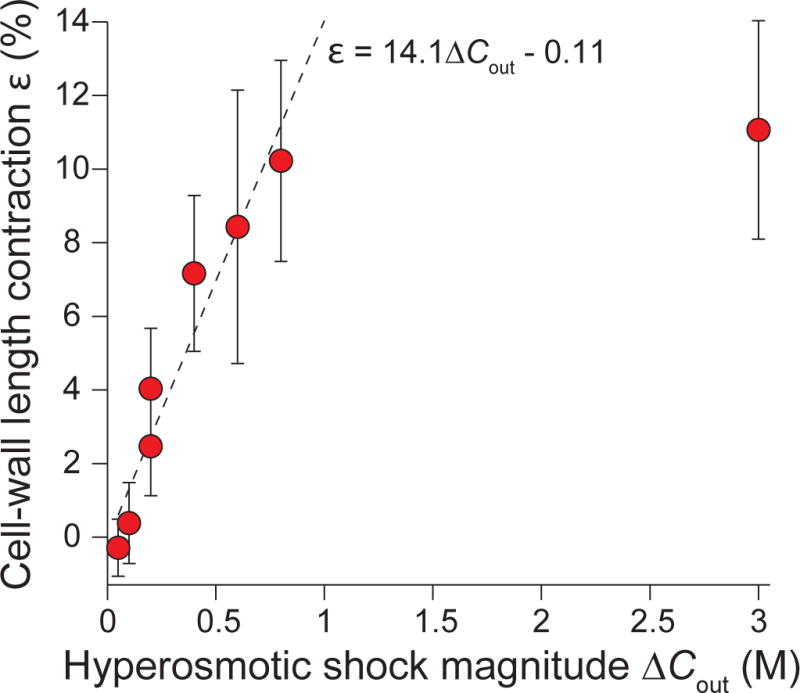
Population-averaged contraction of cell wall lengths versus hyperosmotic shock magnitude (n = 92, 73, 53, 71, 58, 11, 31, 47 cells). Error bars indicate ±1 s.d. The dotted line is the linear best fit for experimental data for shocks with magnitude ≤ 800 mM. The plateau after 800 mM demonstrates that the cell envelope has reached its minimum length upon large, 3 M hyperosmotic shocks.