
Figure 3. The stiffness of turgid cells depends on outer-membrane integrity.
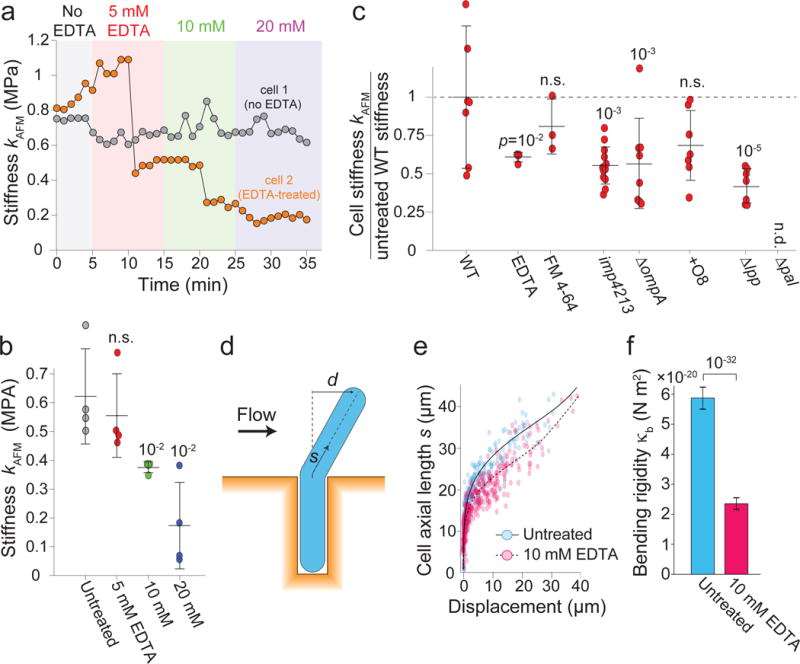
a) AFM measurements of cell stiffness versus time. One cell was treated with increasing EDTA concentrations (similar data for 4 treated, 2 untreated cells).
b) Mean cell stiffness versus EDTA concentration (n = 4 cells for each measurement). Error bars, ± 1 s.d. p-values: Student’s two-sided t-test, difference from untreated wild-type control. n.s.: not significant.
c) AFM measurements of cell stiffness under chemical or genetic perturbations (relative to untreated wild-type, n=7,4,3,13,8,7,7 cells). Δpal cells lysed under AFM. Error bars, ± 1 s.d. p-values: Student’s two-sided t-test, difference from untreated wild-type control. n.s.: not significant.
d) Microfluidic cell-bending assay.
e) Displacement versus axial length for untreated (blue dots, n = 300) and EDTA-treated (pink dots, n = 367) cells. Solid and dashed black lines, best fits of mechanical model used to calculate the bending rigidities.
f) Mean bending rigidities of untreated and EDTA-treated cells. Error bars, 95% confidence. p-value calculated from confidence intervals.